Residential Energy and Comfort
Architects, designers and builders often want to know how well a building can be expected to perform, and they are interested to know what improvements might be the most effective. Residential energy and comfort performance analysis has typically been difficult to justify due to the limited budgets of most residential projects as well as difficult to integrate given the typical need for quick results. Loisos + Ubbelohde is developing a set of data processing and data visualization tools to give designers and builders quick feedback for assessing the high performance home. Rather than simulating a number of design alternatives in order to prioritize envelope improvements, the results of a single energy simulation are analyzed to identify the components that are contributing most to the heating and cooling energy uses in the building. This analysis produces a prioritized list of components that indicates where additional energy efficiency efforts should be directed (see HVAC Load Factors below).
SERVICES
• Annual hour-by-hour simulations of thermal conditions inside the building without mechanical systems
• Parametric analysis of the role of each building component in providing thermal comfort and autonomy
• Design recommendations for achieving greater thermal comfort and greater energy autonomy
See examples of our Thermal Comfort Projects →
• Simulating annual building energy use at all stages of design process
• Developing early energy use parametrics to identify energy saving opportunities in design alternatives
• Developing suites of energy strategies to reconsider conventional approaches to building energy use
• Comparison of mechanical strategies and HVAC systems in terms of energy use
• Green building certification
• Quantification of energy cost
• Future weather energy simulations
See examples of our Energy Modeling Projects →
(left) The analysis showed that a project in a hot summer continental climate could stand to gain most from improved infiltration and window U-value; (right) For a project in a desert climate, the analysis showed that improved window U-value and reduced solar gain through west-facing glass should be priorities for achieving better envelope energy efficiency, and that a high mass option provided better results than low mass.
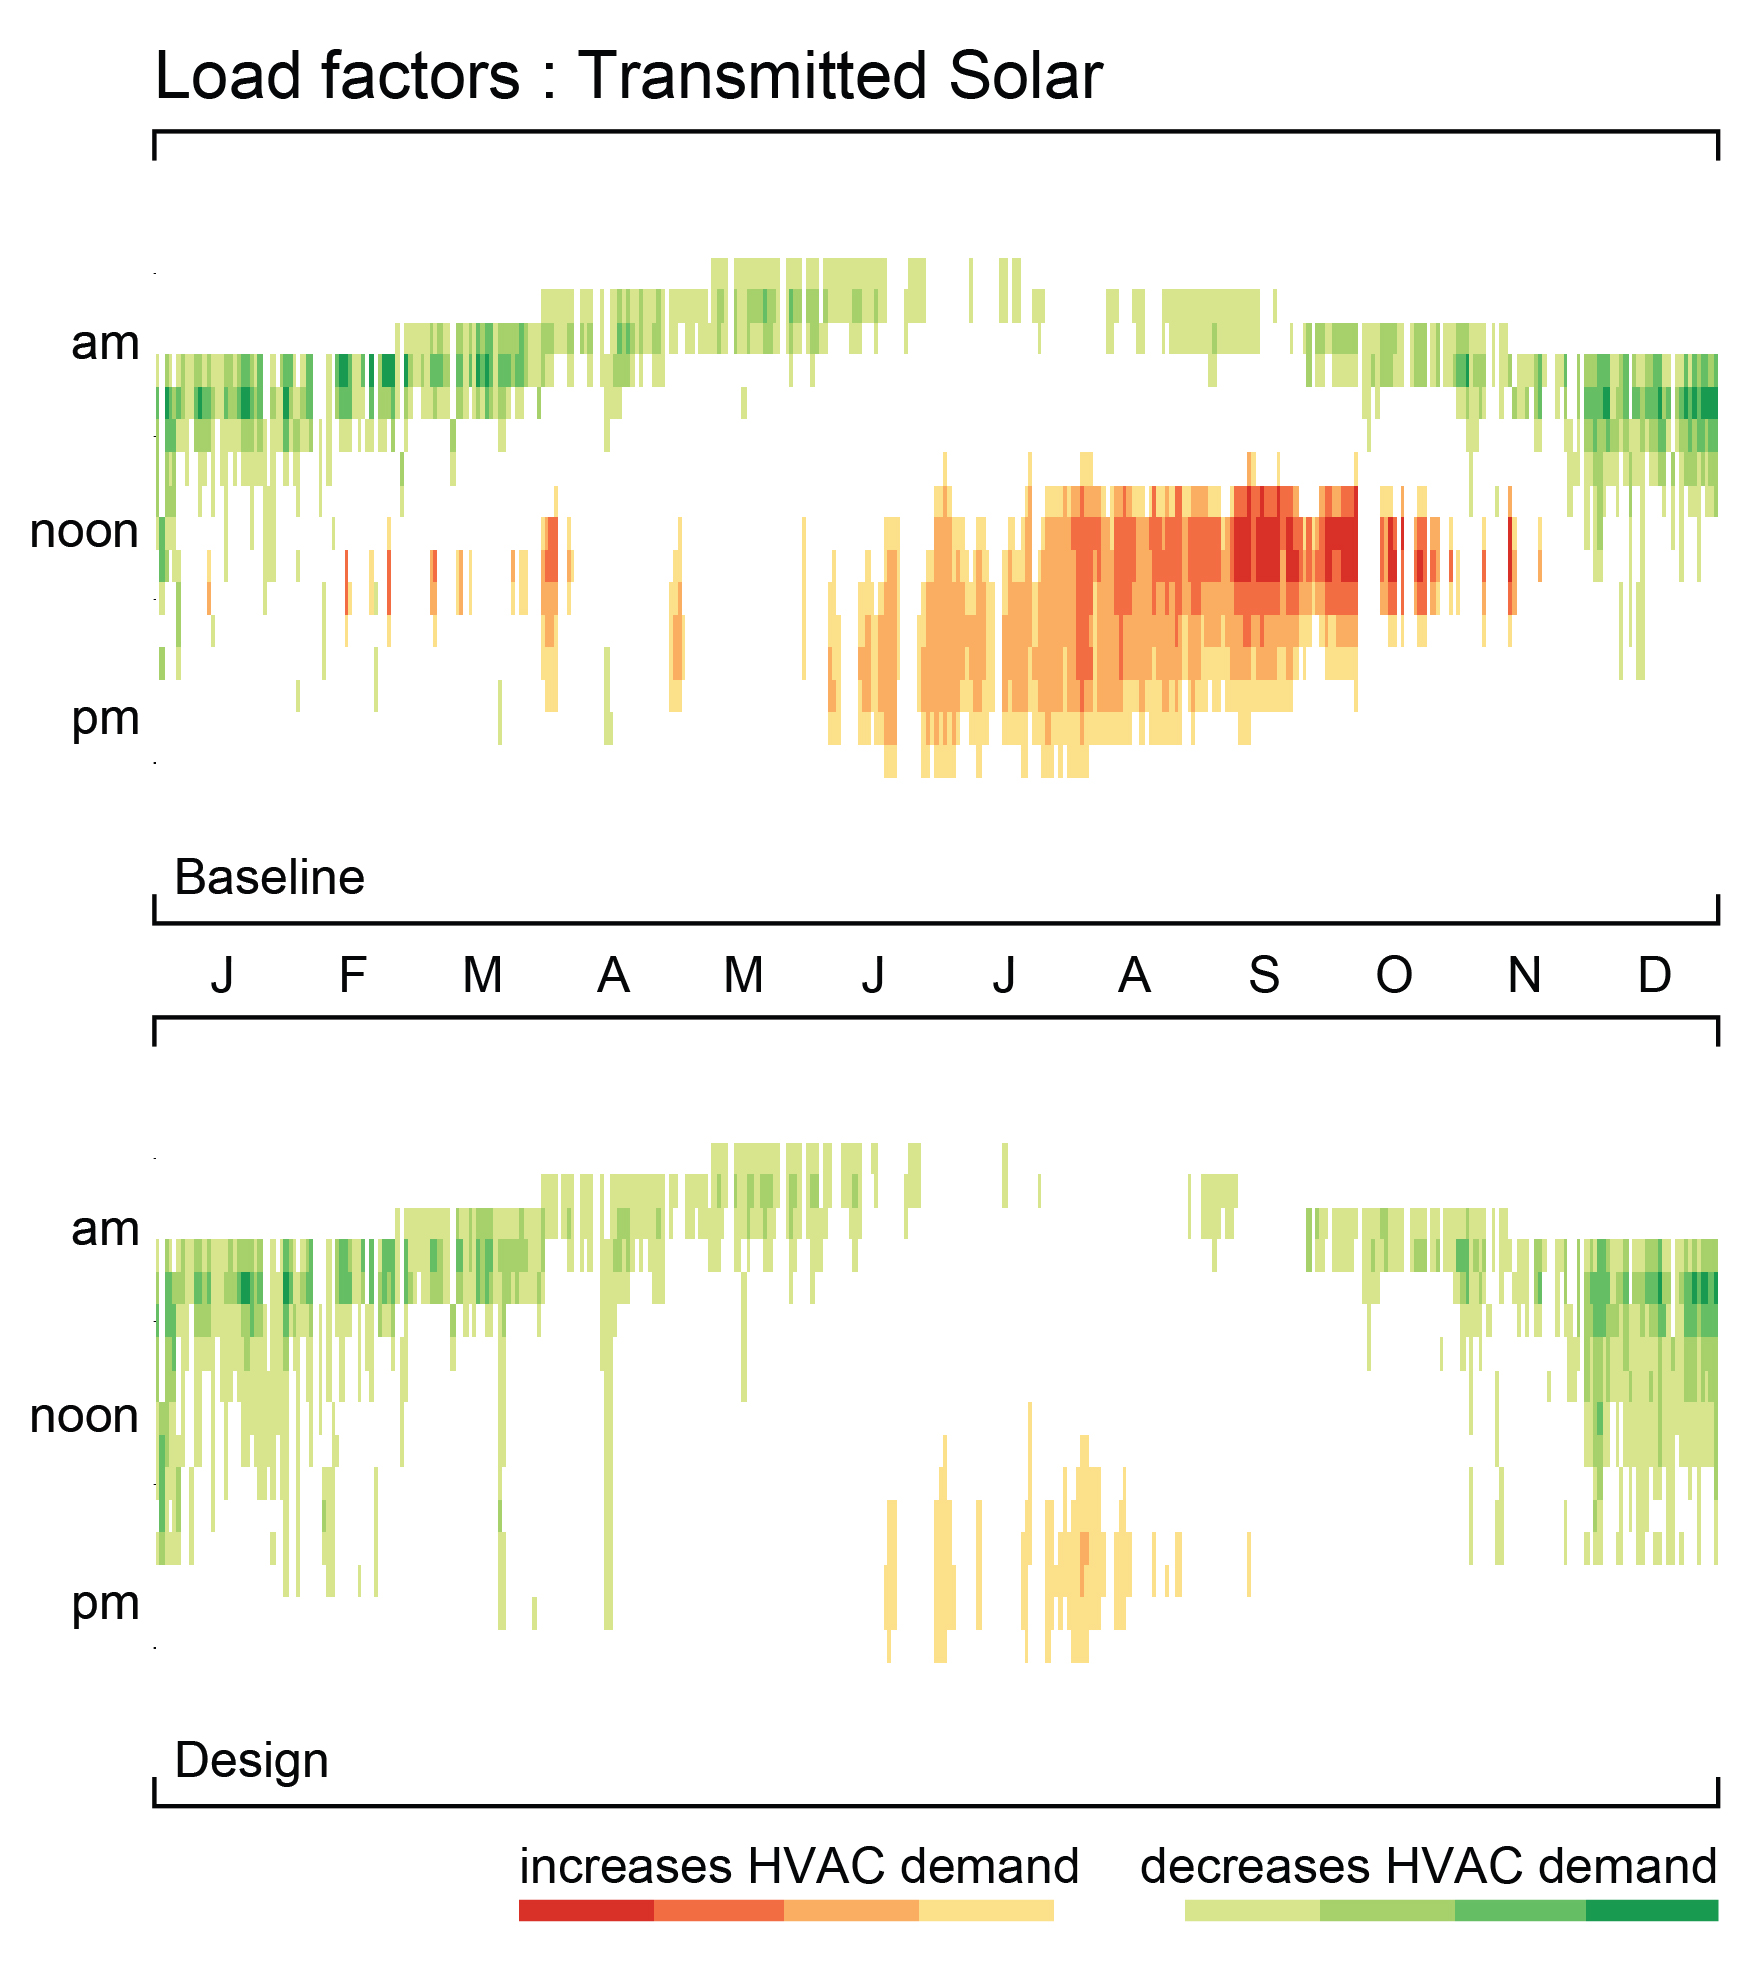
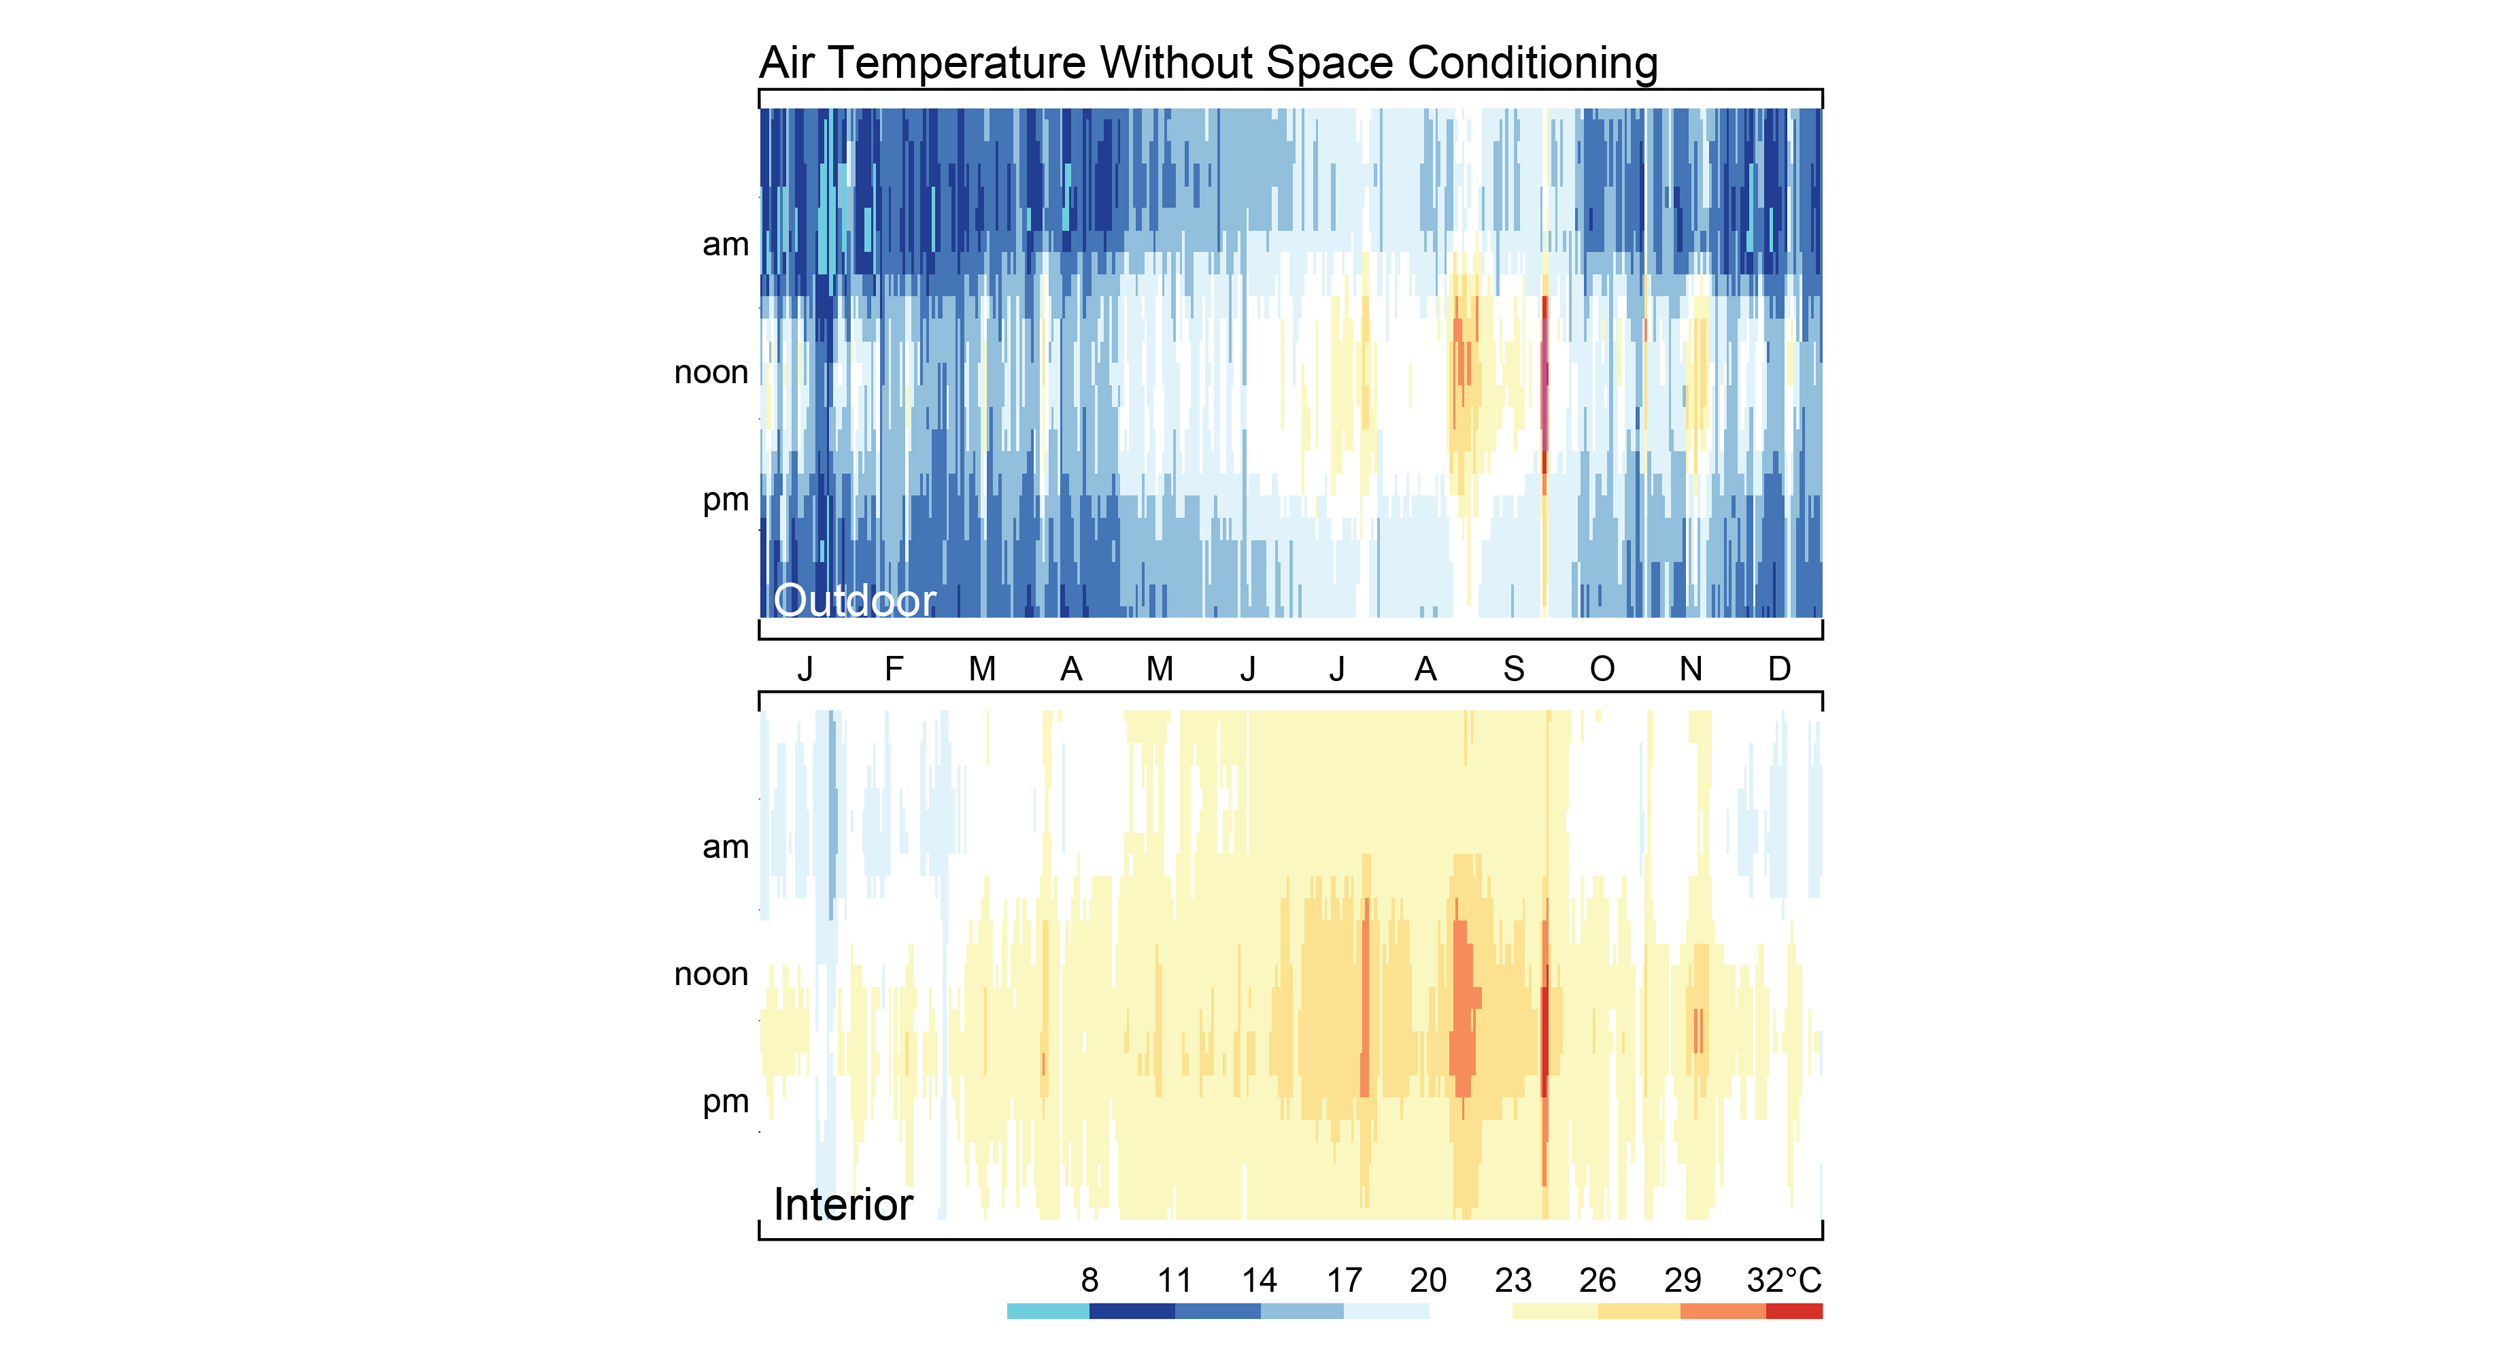
The tools utilize data visualization as a method of analyzing energy and occupant comfort to support design. The power of detailed data visualization is to capture yearly as well as daily trends in the same graphic. This allows the design team to simultaneously investigate the effects of design moves at different time scales. For example, the visualizations Load Factors: Transmitted Solar above show that adding shading decreased unwanted summer afternoon solar gain while still allowing desirable winter morning solar gain. Data visualization also allows quick assessment of unconditioned performance. For instance, a high mass building was modeled in a warm Mediterranean climate, and the design team wondered how comfortable the building would be relying solely on passive means: thermal mass, shading, and natural ventilation. The following graphic Air Temperature Without Space Conditioning was produced to compare daily and yearly temperature profiles of the interior and outdoor conditions, revealing that the need for active conditioning was limited to winter nights and summer afternoons.


