EXPERTISE
Crissy Field Center
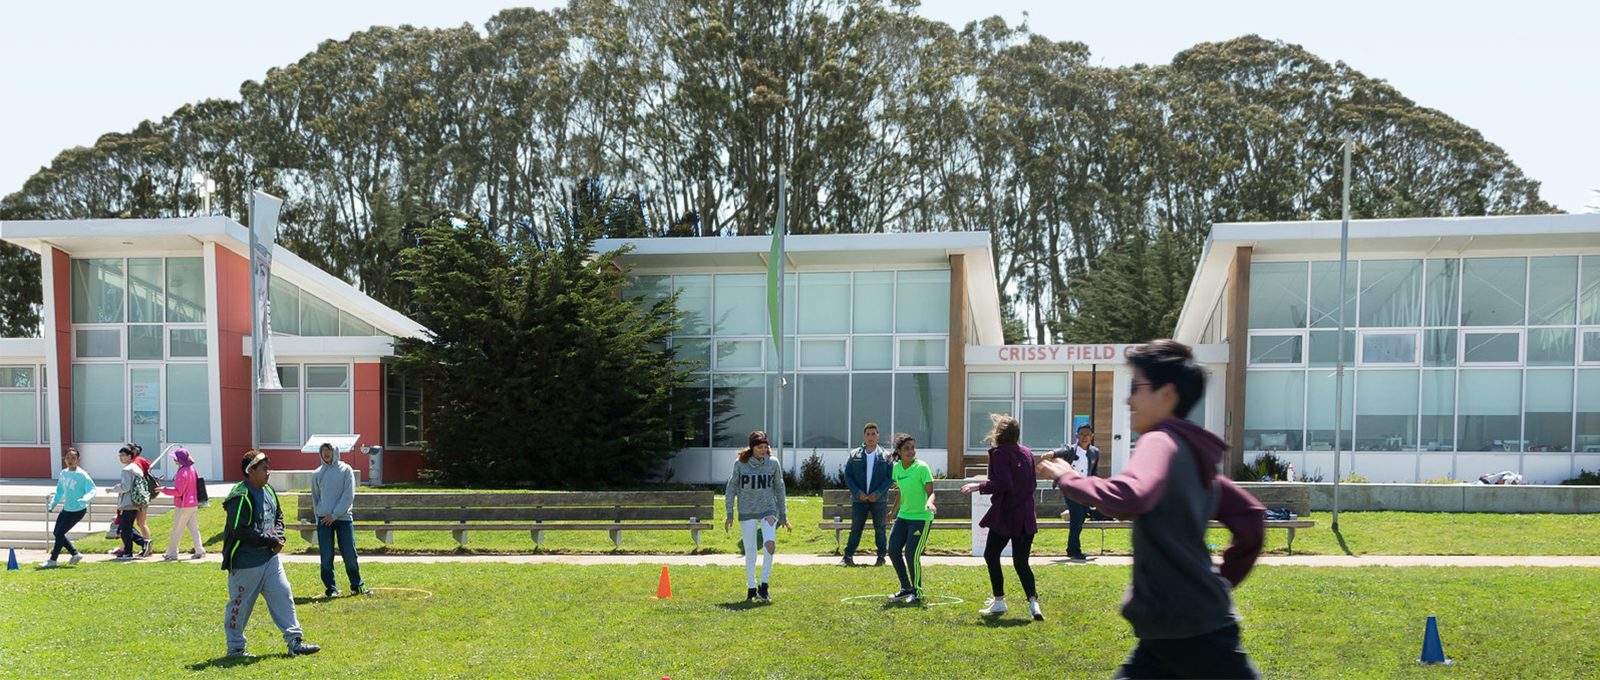
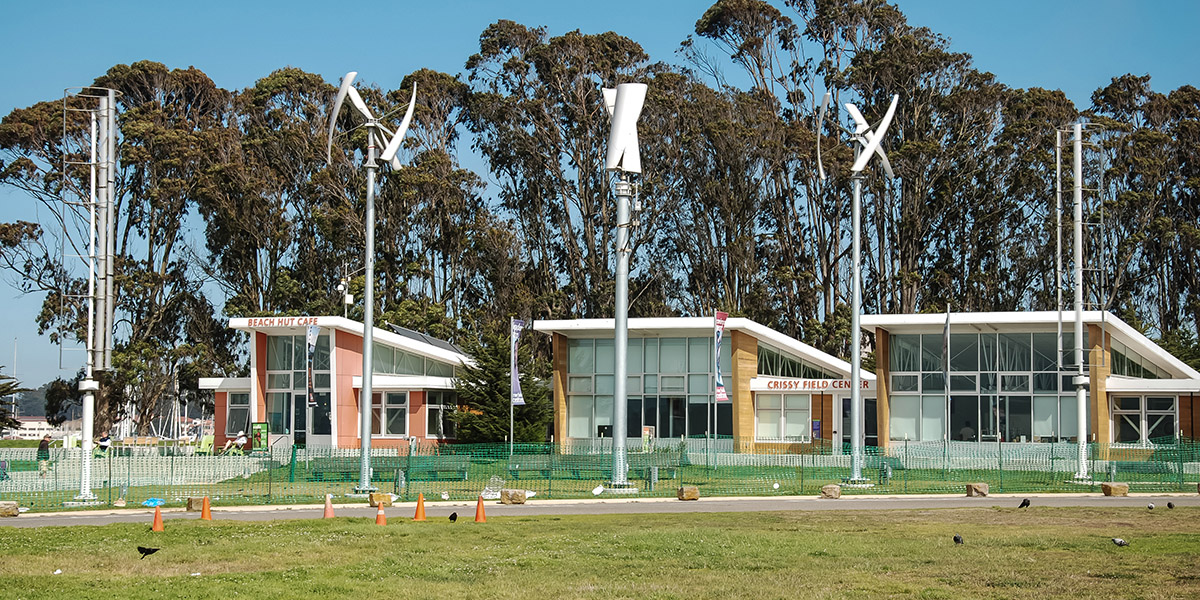
The Crissy Field Center and Beach Hut Cafe are located in Golden Gate Park on San Francisco’s waterfront. The flexible building system is model of sustainable development for the students and community served by this environmental education facility. By integrating a visible series of ZEB strategies and providing real time data, the project serves to demonstrate energy efficient design and energy generation.
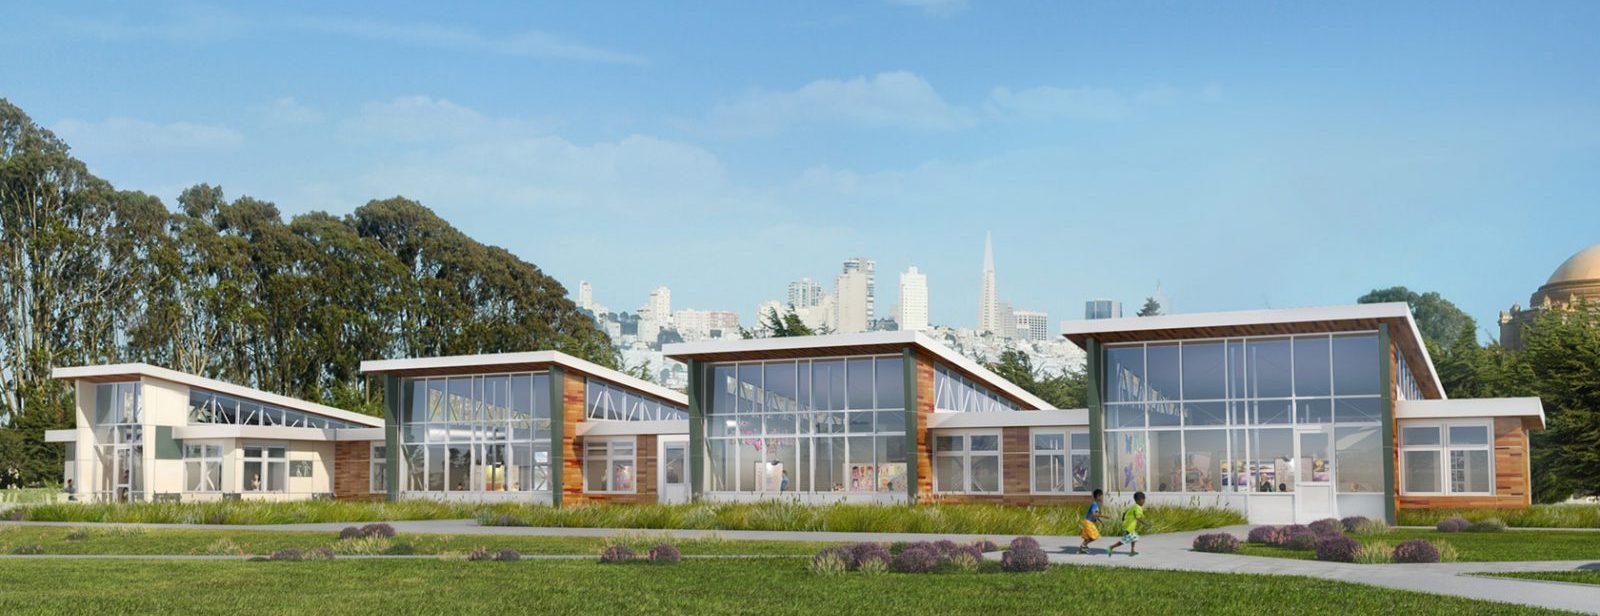
Early rendering of the project on site.
SERVICES
• Predict and evaluate illumination levels and light distribution
• Predict and analyze luminance gradients and glare potential
• Analyze thermal and energy use implications of daylighting design
• Design and evaluate daylighting to exhibition and curatorial performance criteria
• Predict energy savings from daylight harvesting
• Coordinate daylighting and electrical lighting design
• Post-occupancy HDRI analysis of luminance and visual comfort
See examples of our Daylighting Projects →
• Analyze visual performance of glazing alternatives
• Evaluate advanced glazing applications, including light redirecting glass and internal shading systems
• Predict and evaluate thermal performance of curtain wall systems
• Predict occupant comfort conditions for curtain wall alternatives
• Identify and coordinate value engineering tradeoffs for integrated high-performance facades
See examples of our Glazing Selection Projects →
• Analyze site conditions for solar access and shade potential
• Design sun control and glare control alternatives for local skies and climate conditions
• Evaluate shade alternatives for visual and thermal comfort
See examples of our Shading Design Projects →
• Annual hour-by-hour simulations of thermal conditions inside the building without mechanical systems
• Parametric analysis of the role of each building component in providing thermal comfort and autonomy
• Design recommendations for achieving greater thermal comfort and greater energy autonomy
See examples of our Thermal Comfort Projects →
• Simulating annual building energy use at all stages of design process
• Developing early energy use parametrics to identify energy saving opportunities in design alternatives
• Developing suites of energy strategies to reconsider conventional approaches to building energy use
• Comparison of mechanical strategies and HVAC systems in terms of energy use
• Green building certification
• Quantification of energy cost
• Future weather energy simulations
See examples of our Energy Modeling Projects →
• Quantify solar and wind potential
• Identify and size appropriate alternative energy sources including photovoltaic cells, wind turbines, and fuel cells
• Coordinate location and installation issues with the design team
• Identify renewable energy that can be sourced through public utilities and renewable energy vendors
See examples of our Renewable Energy Projects →
• sensors tracking energy use, system performance, and variables related to occupant comfort,
• scalable architecture designed to serve multiple buildings,
• proprietary software to collect, transmit, process and log data, and
• a centralized database for streamlining data mining, performance analytics, and controls research.
See examples of our Monitoring Projects →
• Strategically identify and locate the path of ventilating air
• Quantify the available wind on site in terms of direction, velocity and patterns of availability
• Size and locate openings for incoming air and exhaust
• Coordinate the mechanical system with natural ventilation as an operating protocol
See examples of our Natural Ventilation Projects →
• Predicting potential future conditions resulting from abrupt or gradual change
• Simulating and designing for zero-energy as a baseline performance
• Simulating and designing for passive survivability for critical life-support conditions
• Designing renewable energy sources and storage for resilient scenarios
• Providing a manual for phases of disaster response and operation
See examples of our Resilience Projects →
See examples of our Zero Energy Building Projects →
See examples of our Dashboard Projects →
SPECIALTY SERVICES
L+U provides schematic system design for space conditioning and ventilation systems. We work in coordination with the architect, mechanical engineer, and mechanical subcontractor to create comfortable and sustainable environments that are architecturally-integrated, cost-effective, and low-maintenance.
- Preliminary system sizing and load calculations
- Systems diagrams and controls sequence of operation narrative
- Equipment performance and code compliance specifications
- Preliminary equipment specification
AWARDS
LEED-NC Platinum certification
Best Green Building Award, California Construction 2010
Environmental Achievement Award, National Park Service 2011
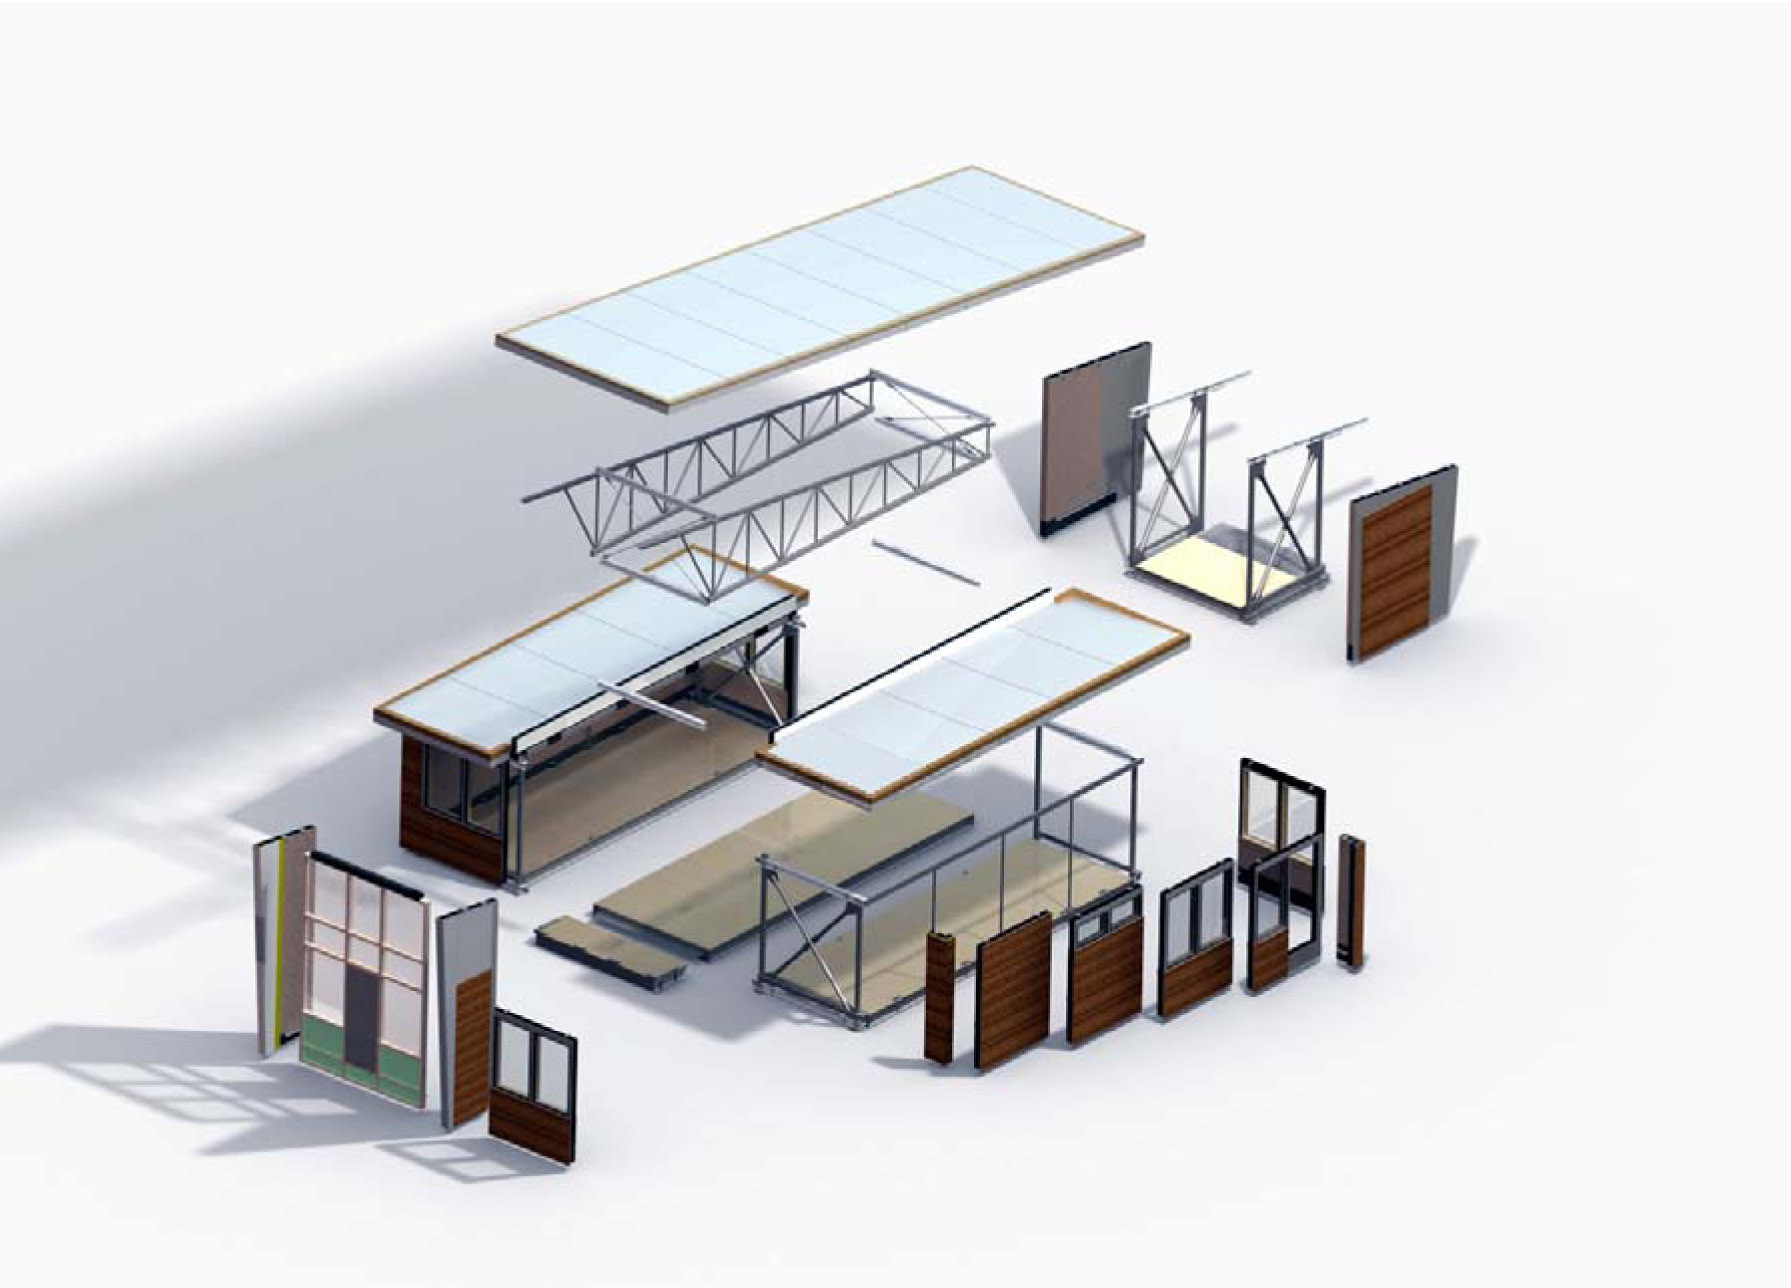
The project incorporates a flexible panelized building system developed by San Francisco based Project Frog. This system met the Conservancy’s timeline and budget without compromising on sustainability performance or aesthetics. Due to its prominent location and focus on environmental education, the design team focused on a high-performance envelope as well as an array of green features both inside and out.
Project Frog modular building platform.
The Crissy Field Center was one outcome of a collaboration between Project FROG and Loisos + Ubbelohde. Overall, the collaboration sought to answer a complex research question: how to use a prefabricated classroom characterized by quick construction, lower costs, high quality control and basic green performance and design it to achieve zero net-energy, zero-net carbon emissions and high quality interior space efficiently and appropriately for any given site and climate?
As part of the research, sophisticated simulation methods to identify the optimal configuration, envelope design, and mechanical system were developed. The performance modeling worked iteratively with the product development team to ensure that design options identified were realistic from a manufacturing and cost standpoint.
By simulating thermal behavior, energy flows, energy use, natural ventilation, mass effects, occupant thermal comfort, and occupant behavior, the design team was able to identify the path to ZEB performance and to quantify the contribution of each factor.
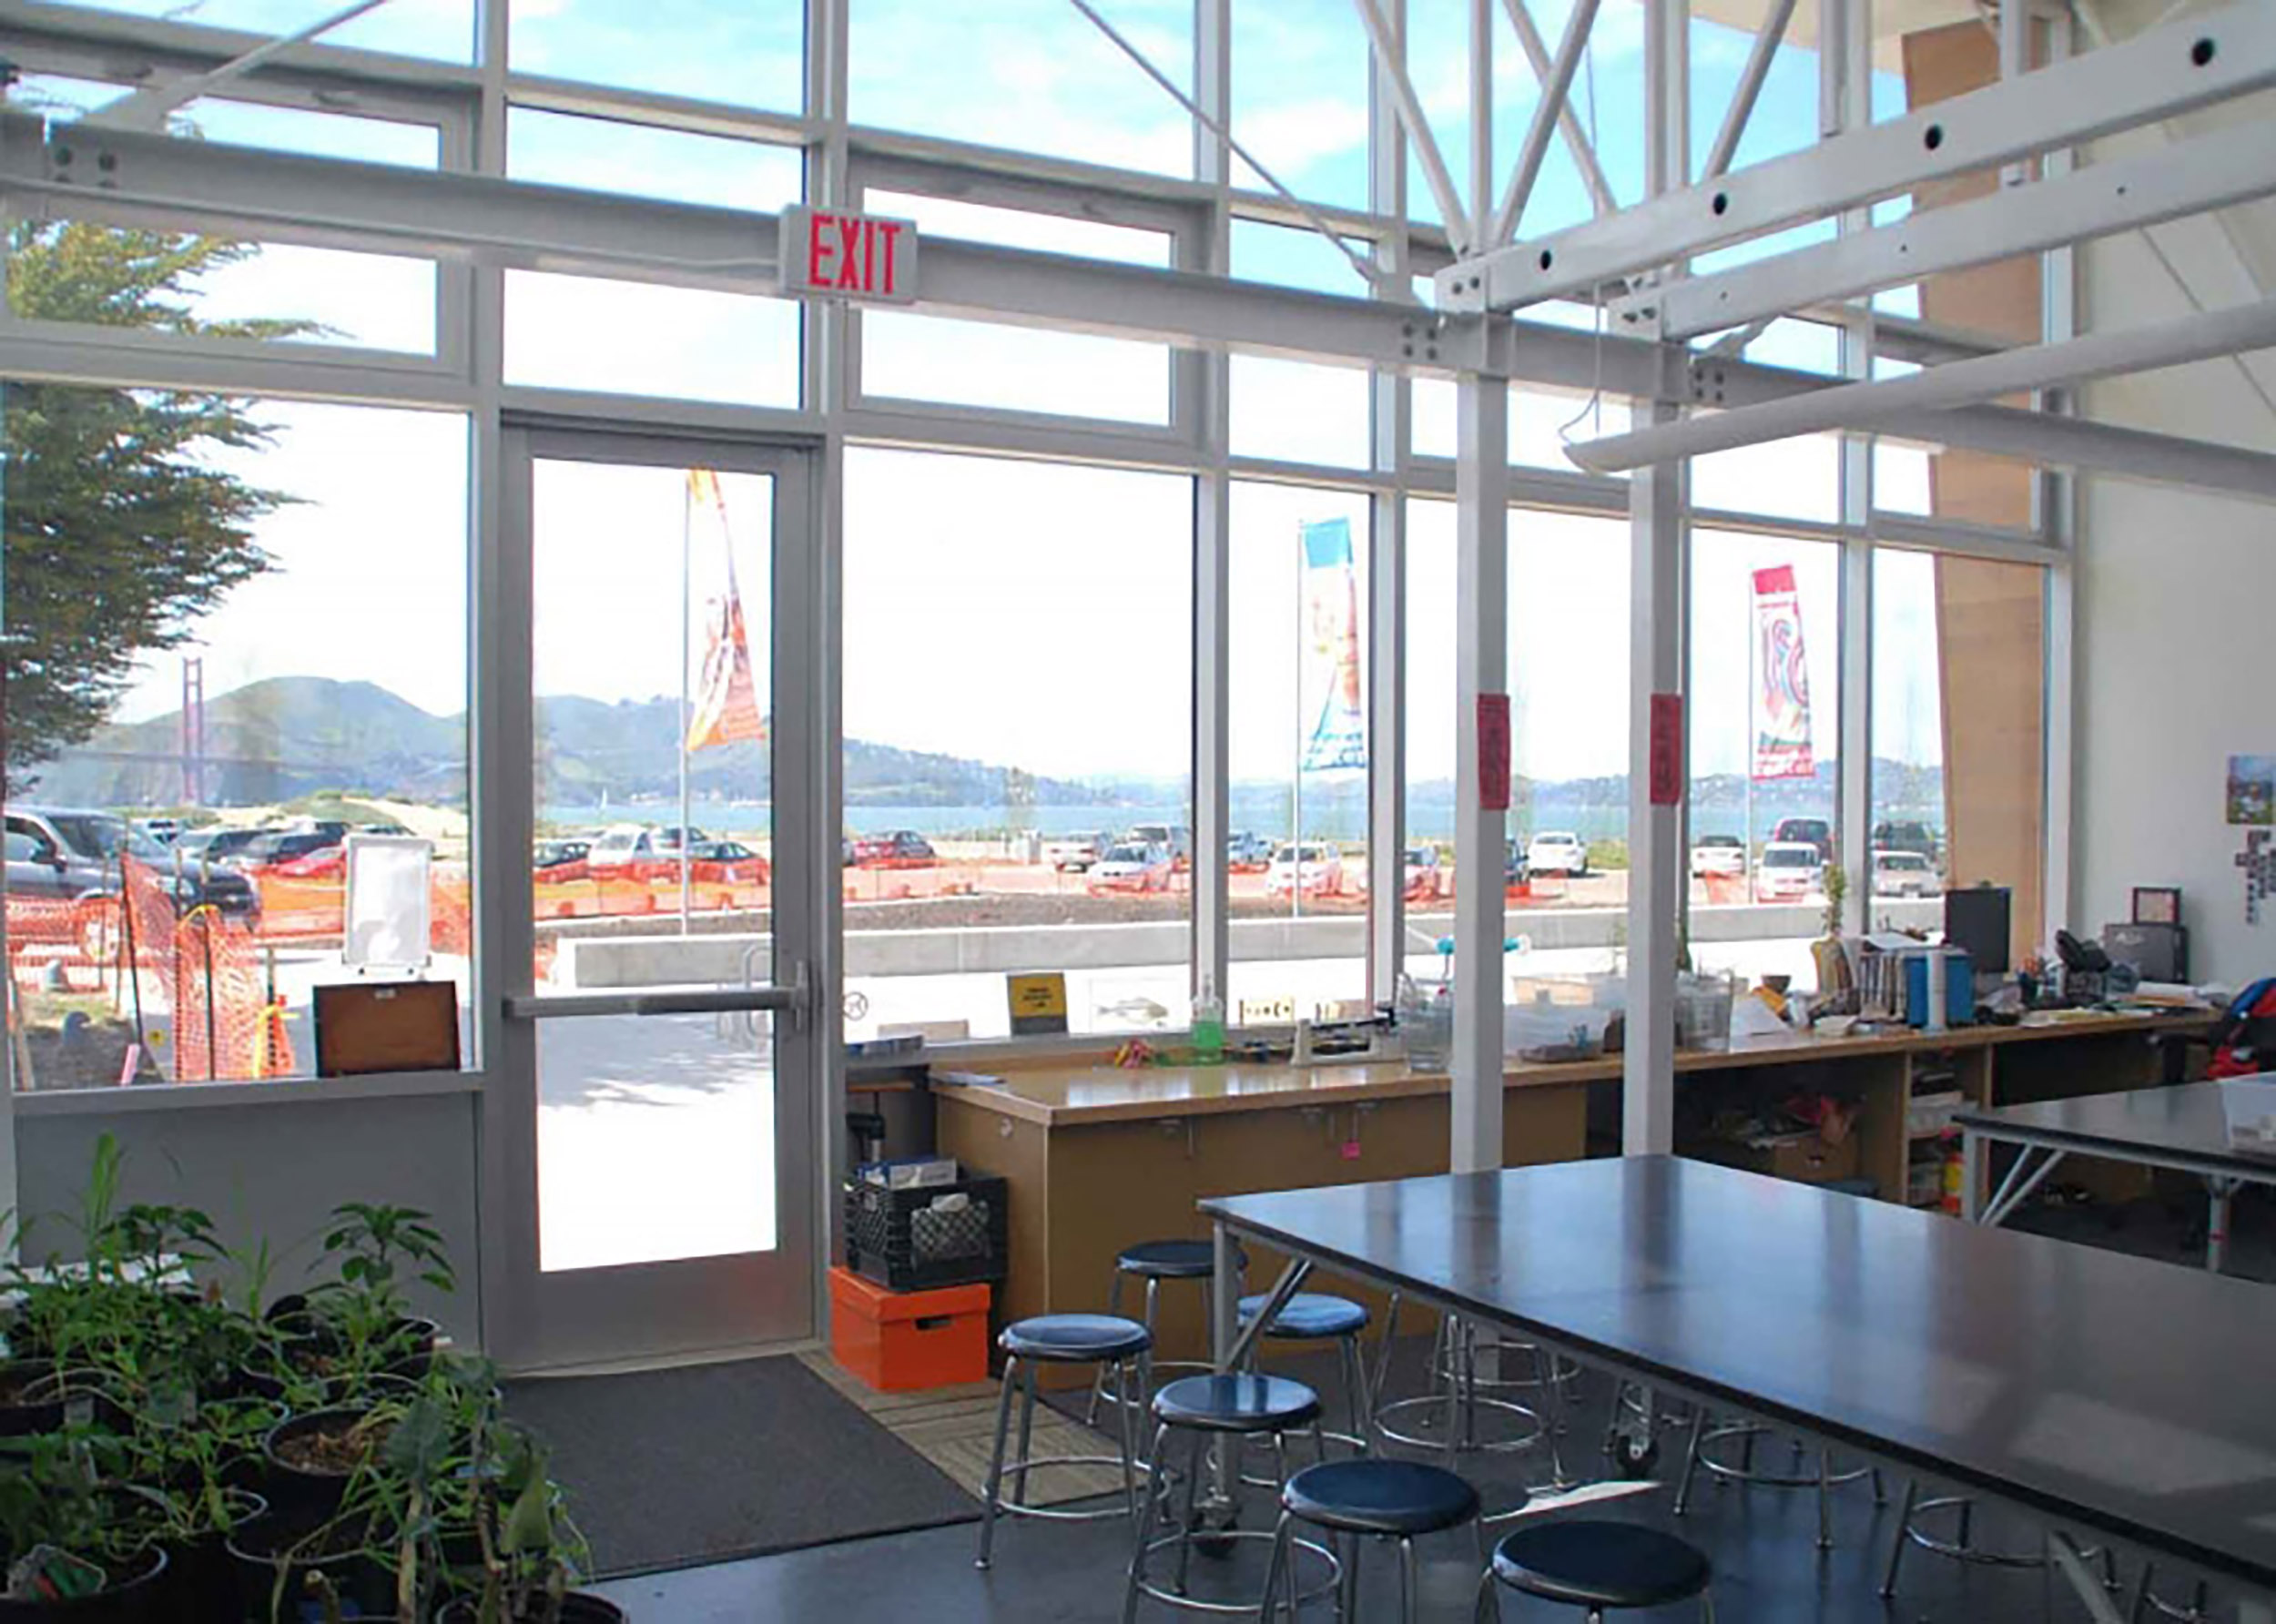
The design team focused on optimizing siting and orientation of the building to create a balance between solar gain, daylighting, prevailing winds, and the expansive views to the Golden Gate Bridge.
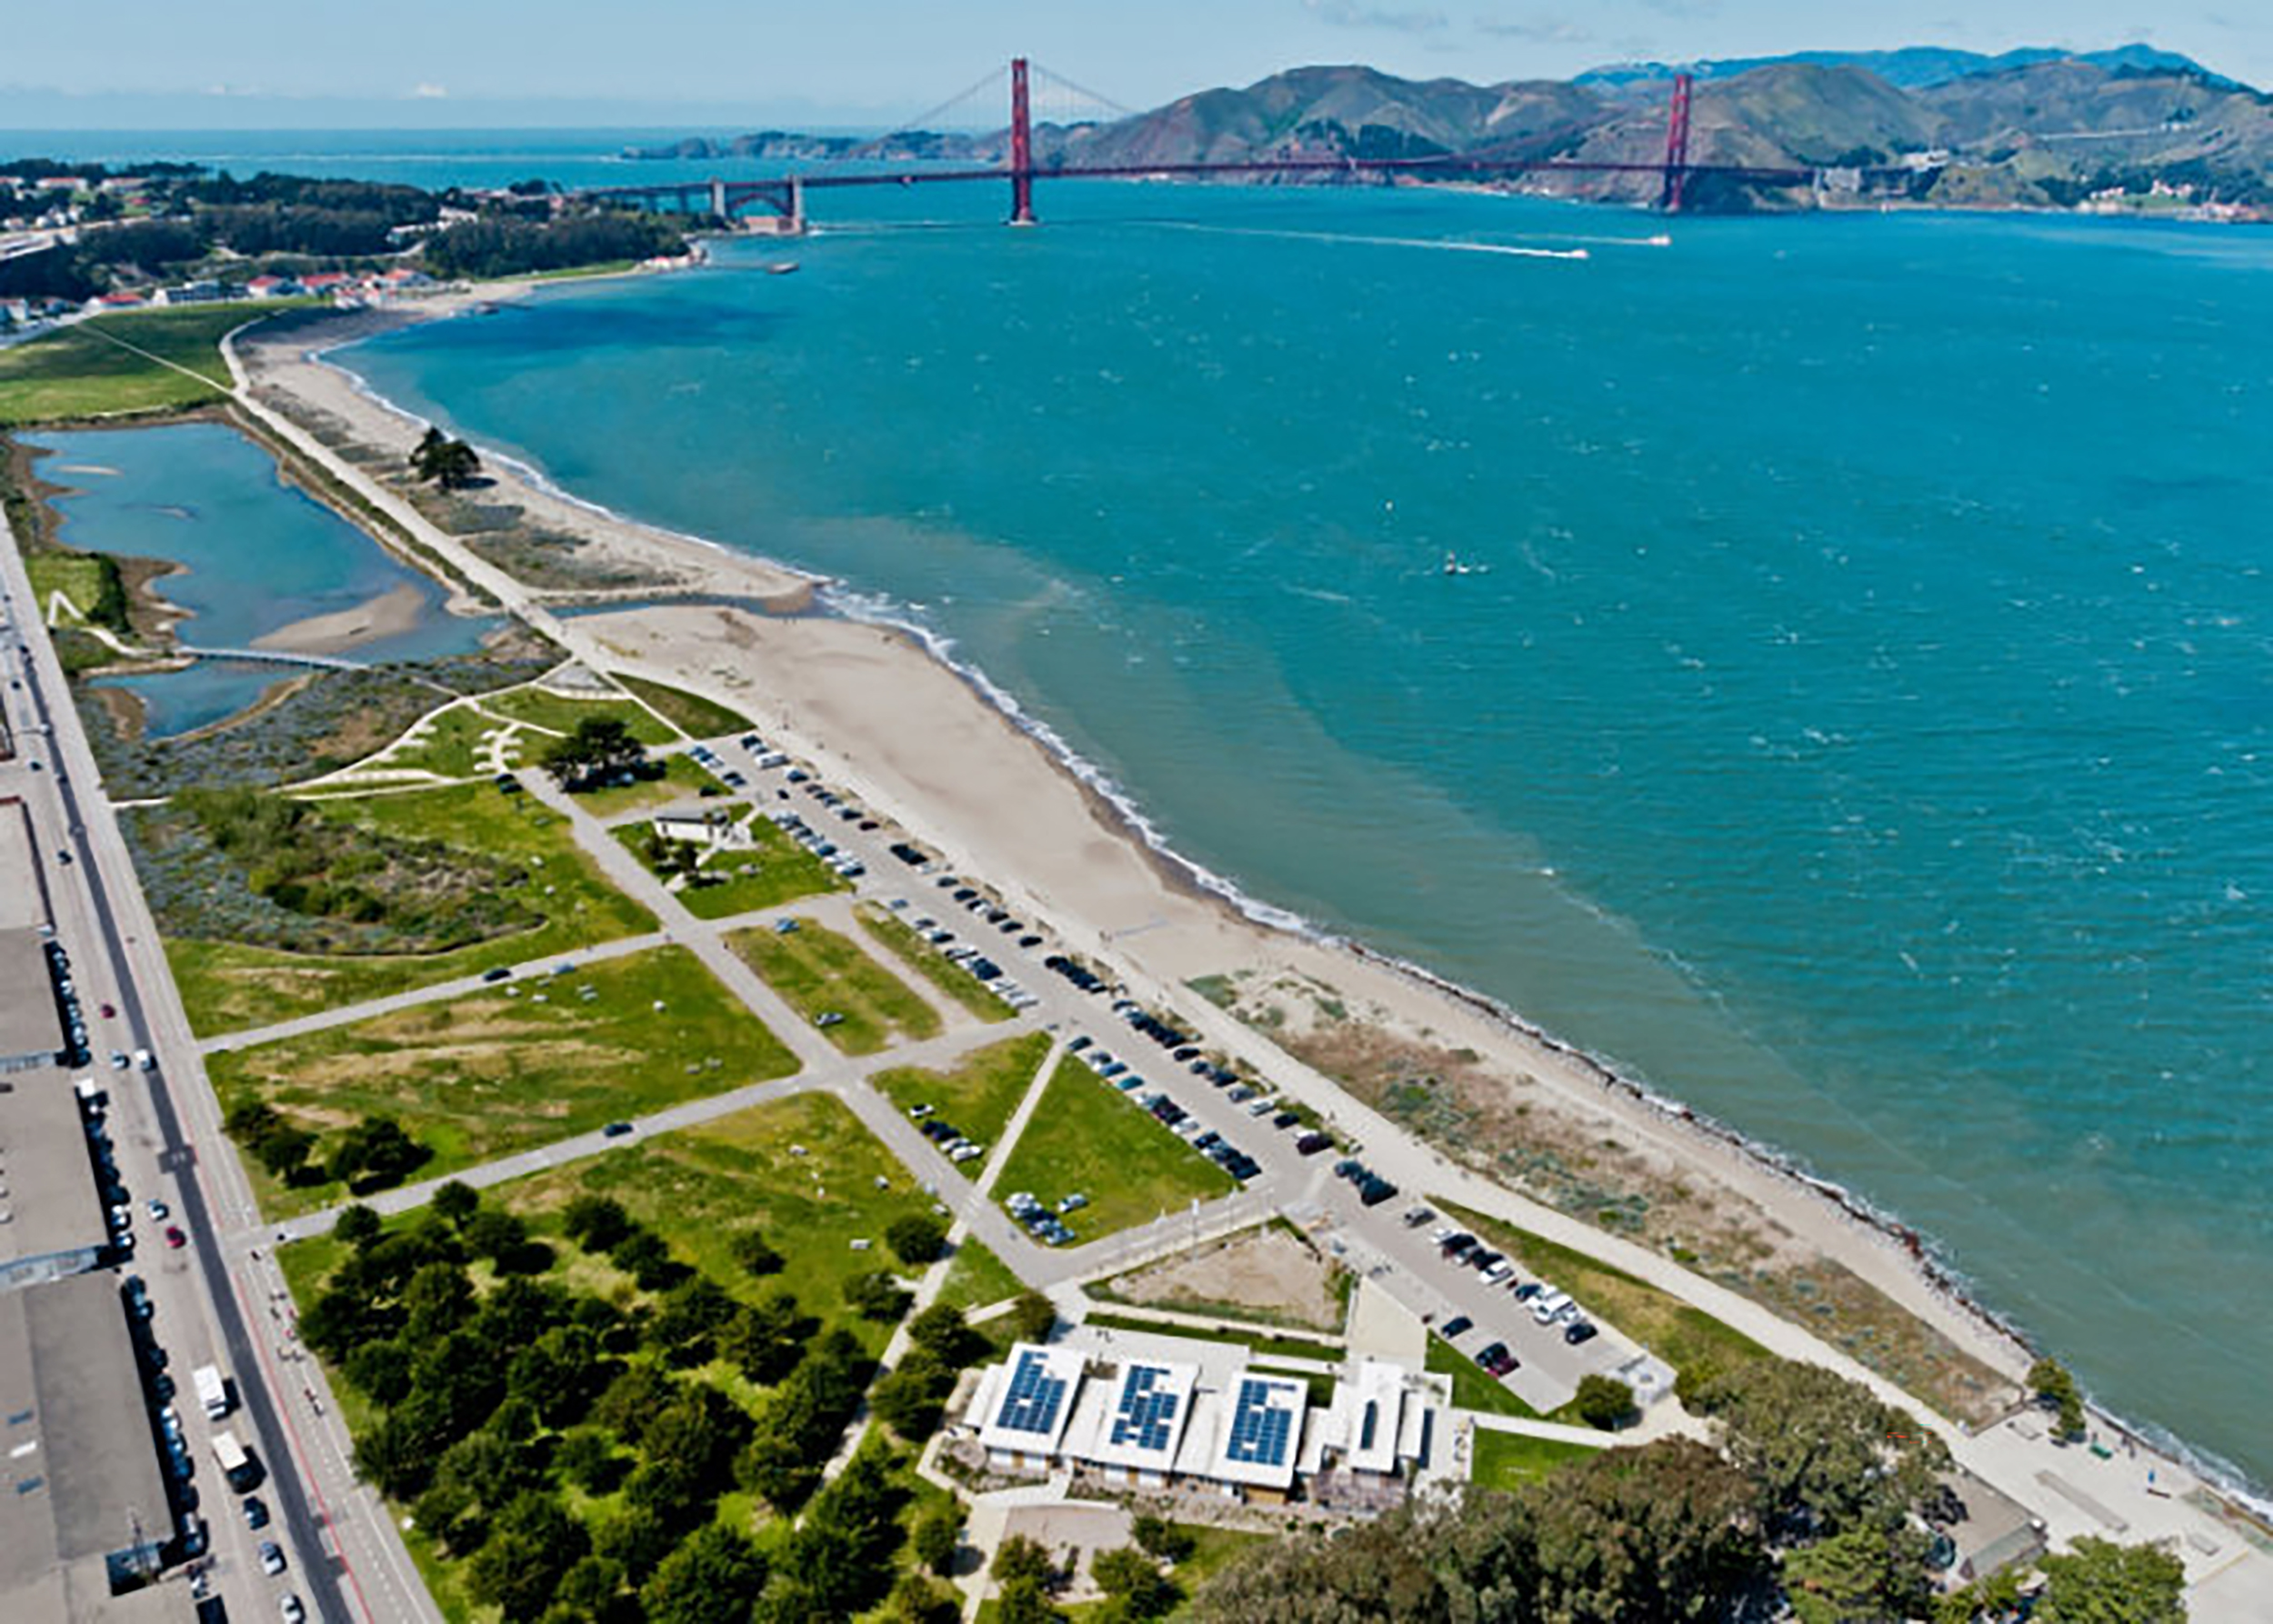
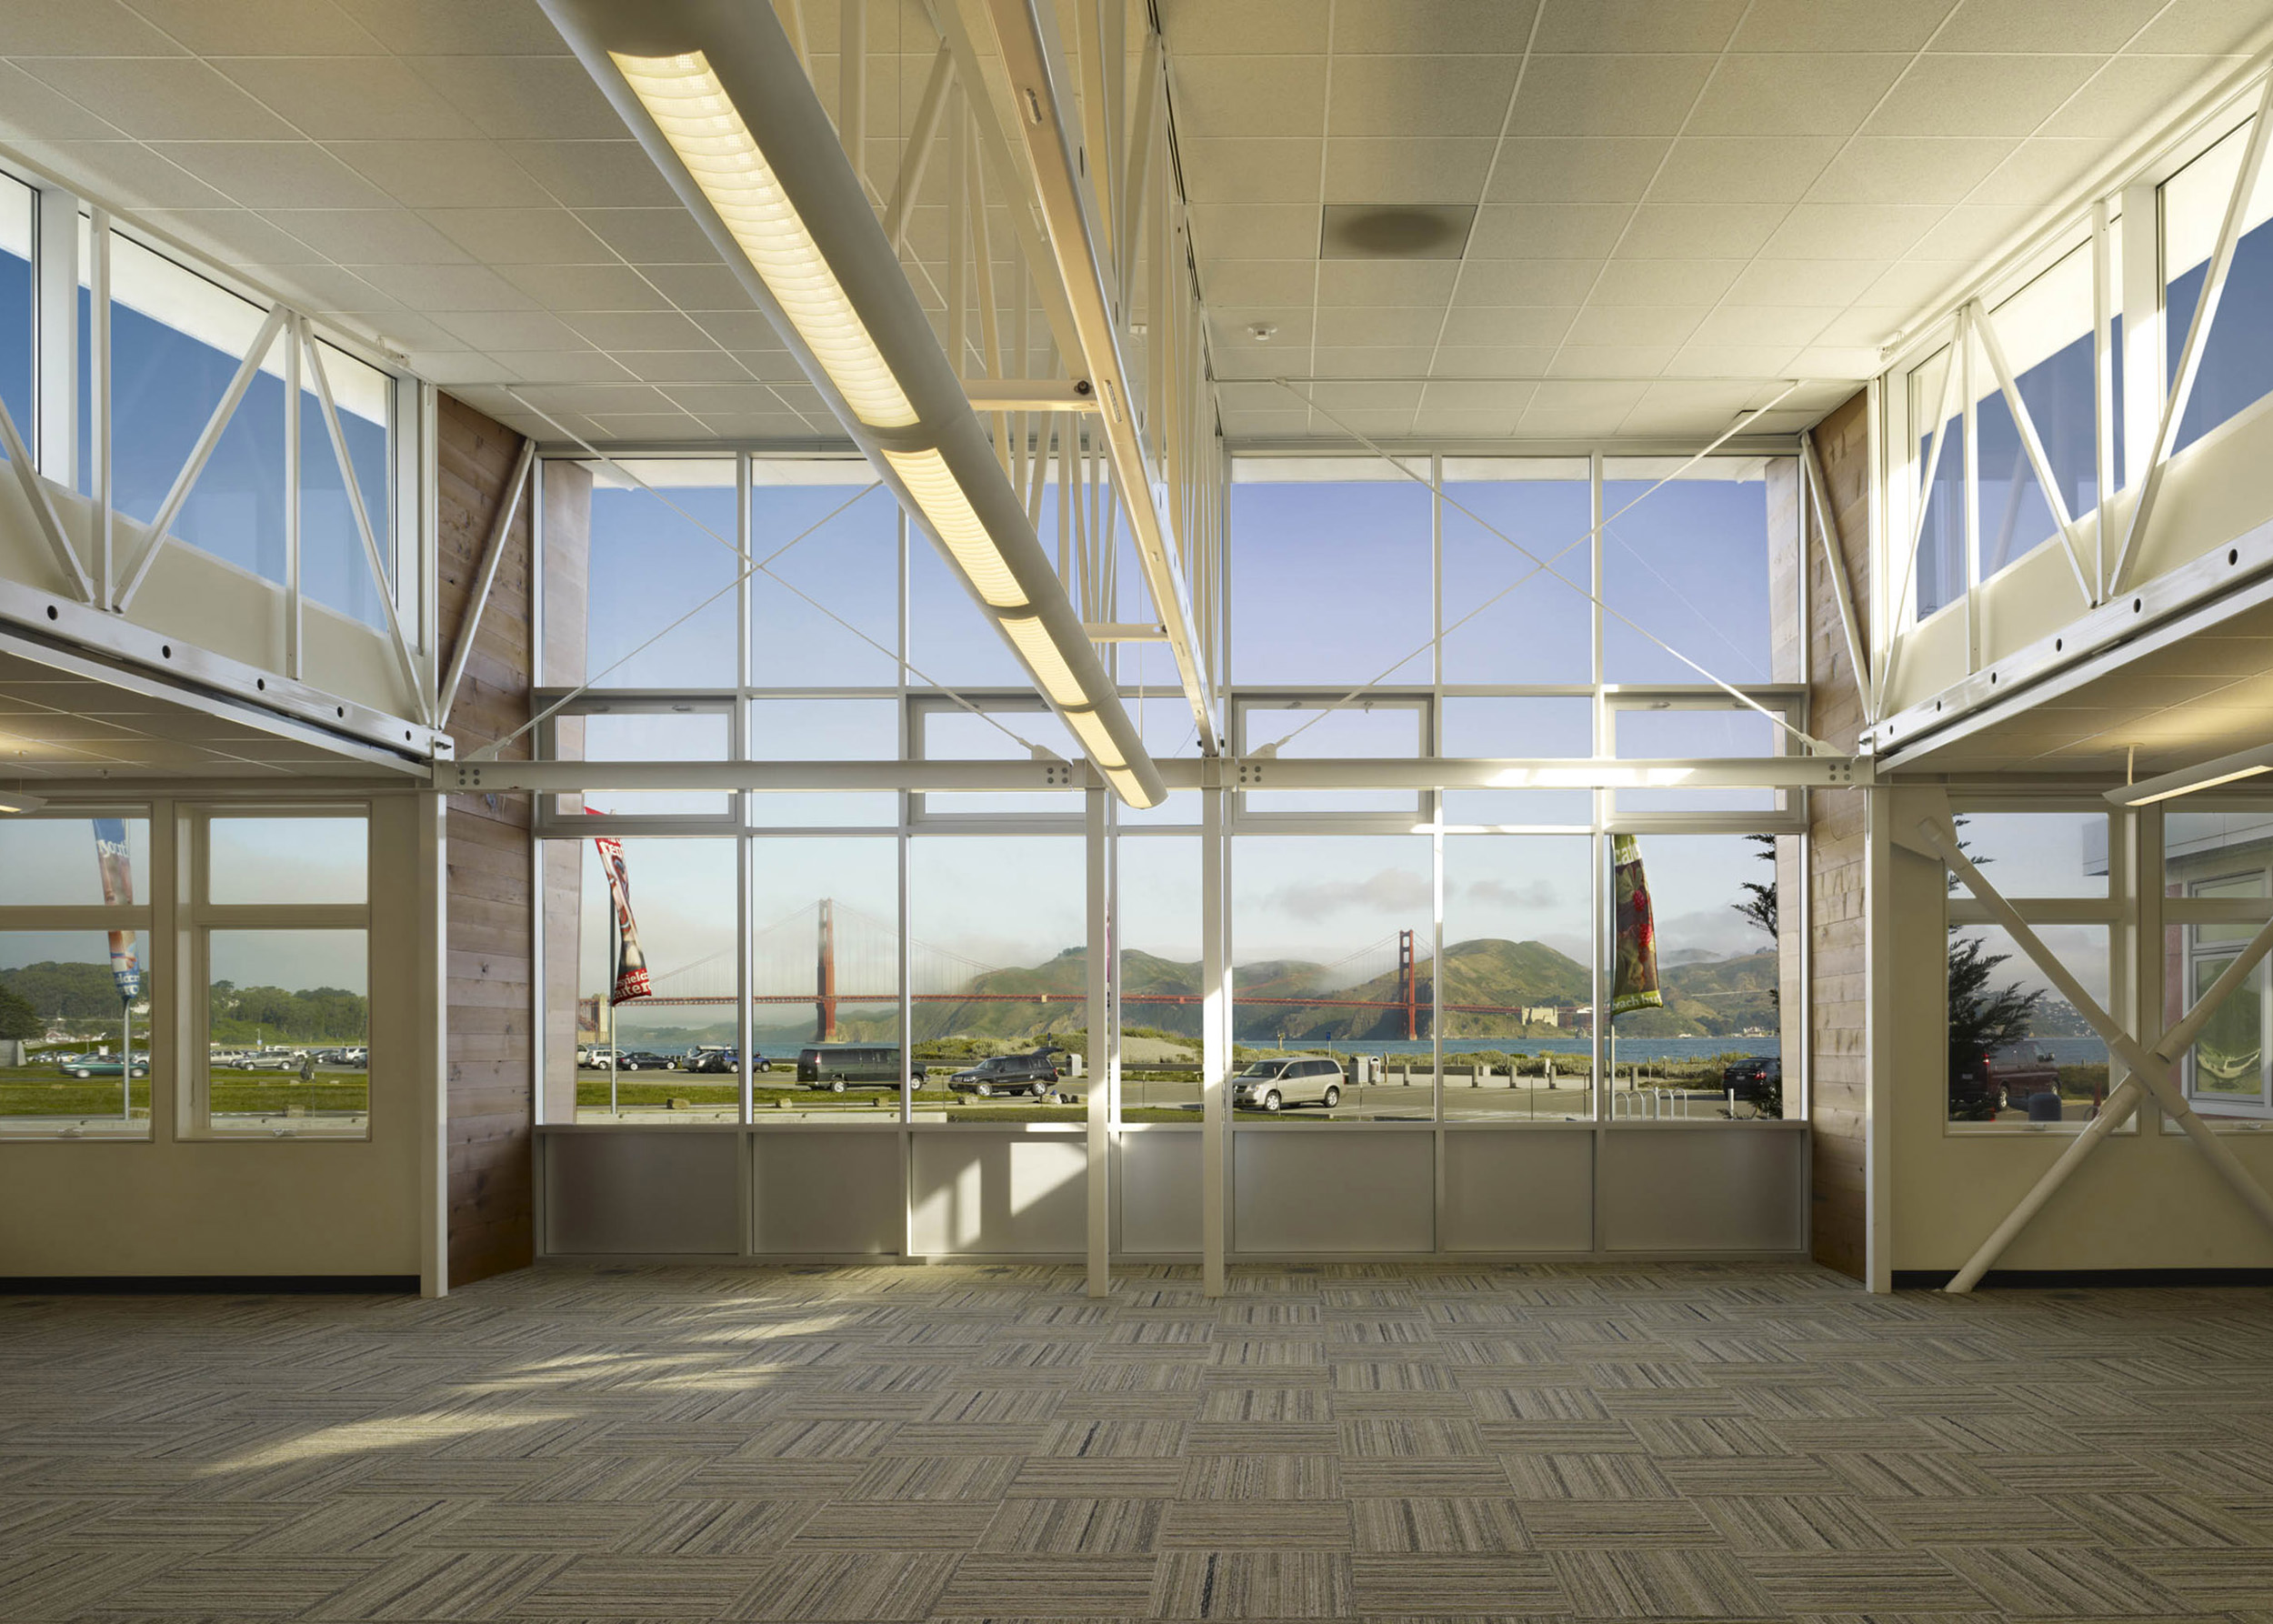
The buildings sit along the beach at the entrance to a reconstructed wetland along San Francisco Bay. The site boasts spectacular views to the Golden Gate Bridge and the Marin Headlands.
To minimize solar gain and maximize views and even daylight, the building is oriented with large windows to the north. Highly reflective surfaces on the building’s exterior, a cool membrane roof and low-e windows reflect the heat away from the building. Inside the wall and roof panels high levels of insulation improve thermal comfort in both cool and hot seasons, reducing mechanical use at the same time. Daylighting and lighting controls reduce lighting electrical loads.
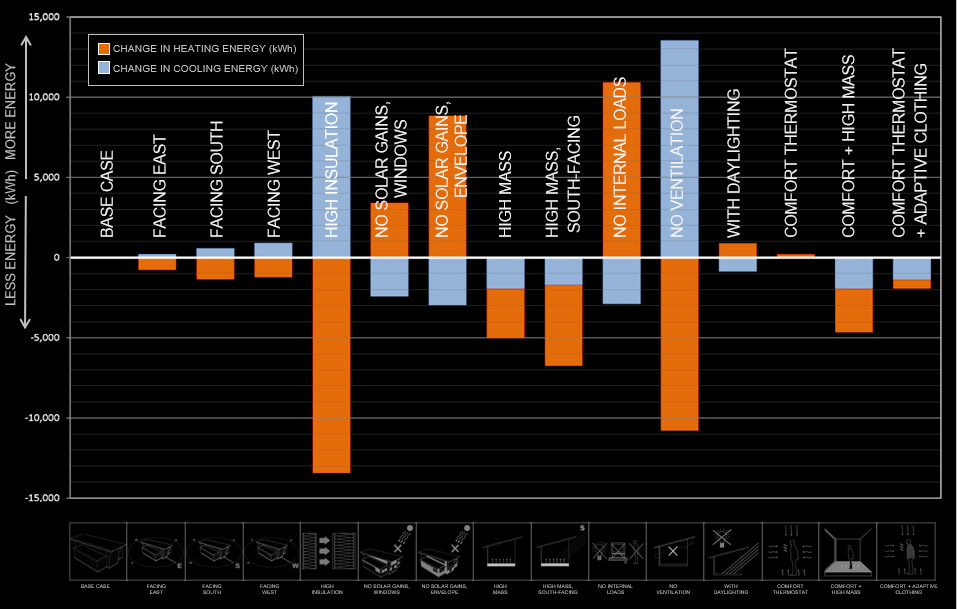
Parametric Analysis for Envelope Optimization
“Elimination Parametrics”, an analytical technique using theoretical building performance scenarios, called helped to define the strengths and weaknesses of the baseline Project Frog building envelope when placed in the specific climate for this project. By eliminating design variables of the base case building one-by-one, we isolated and quantified their relative impact on human comfort and ultimately on the building cooling and heating loads. The bar chart above shows the areas where the greatest benefits can be gained in the San Francisco climate for each design option.
Although conventional thought would have included air conditioning to address the potential for occasionally significant cooling loads, the client and project team favored the sustainability benefits of excluding air conditioning. The location on the San Francisco shoreline delivers cool winds from the Bay year round, providing much of the needed cooling through natural ventilation. An under-floor air distribution (UFAD) system was specified to provide ventilation air and space heating, with the strategy that the raised floor construction had the potential to influence space comfort via the surface temperature of the floor as well as via the air.
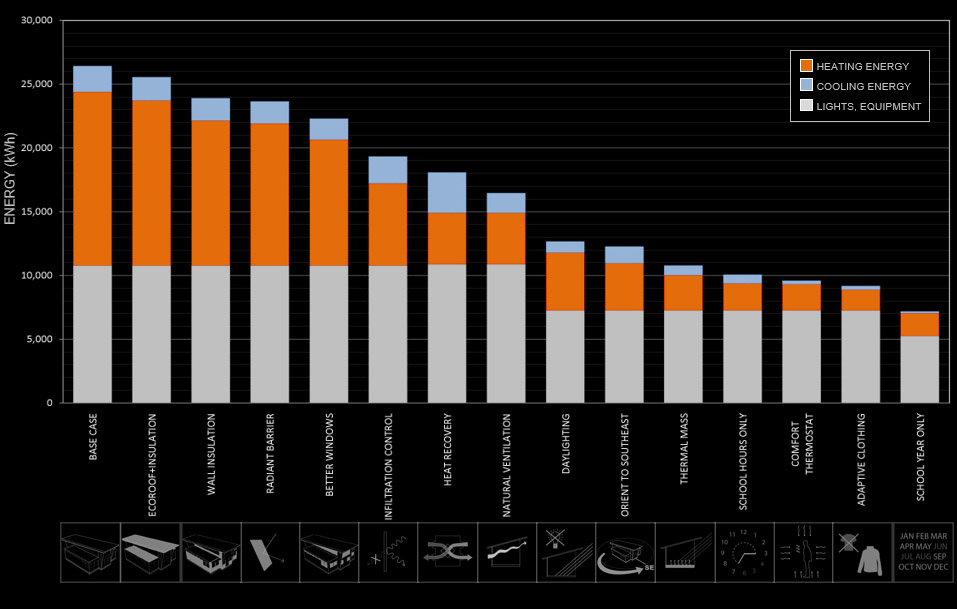
Impact of Cumulative Climate Specific Options in HVAC + Lighting Energy Use.
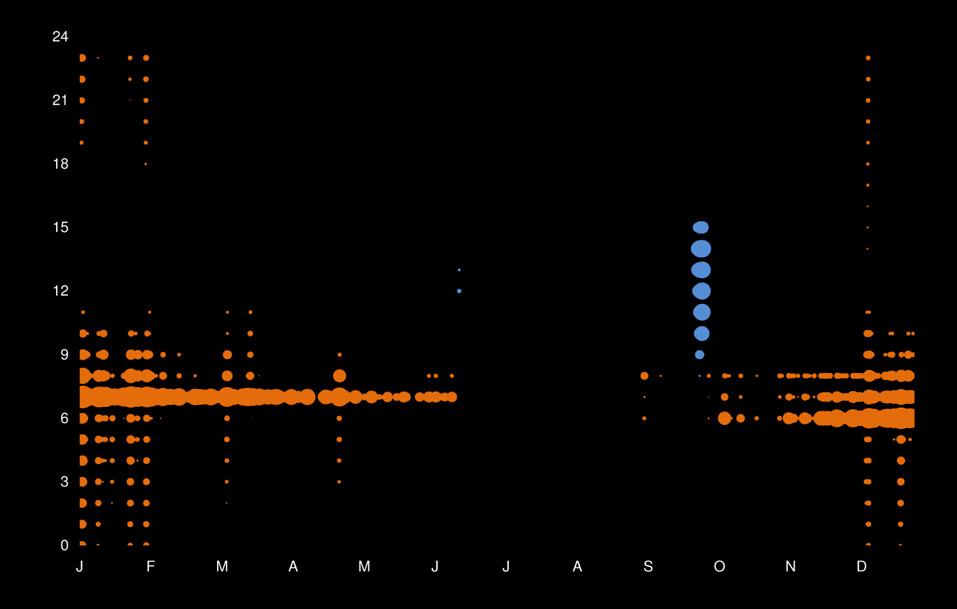
Plot of 24 hour heating and cooling energy use throughout the yeat with all climate specific building options
Based on analysis of the Elimination Parametrics, specific building components and strategies were cumulatively added to the base case model. Nine primary parameters were varied, including: orientation, wall insulation, roof Insulation, thermal mass, shading, three areas of glazing and ventilation area. This suite of components allowed the classrooms to achieve progressively higher standards of energy efficiency and performance. The graph plots the 24-hour energy use throughout the year. Climate-specific building options were cumulatively modeled to show the base case building as it becomes a progressively more energy-efficient building. As the hous of orange (heating) and blue (cooling) fade to black the building can be comfortably occupied increasingly in passive mode.
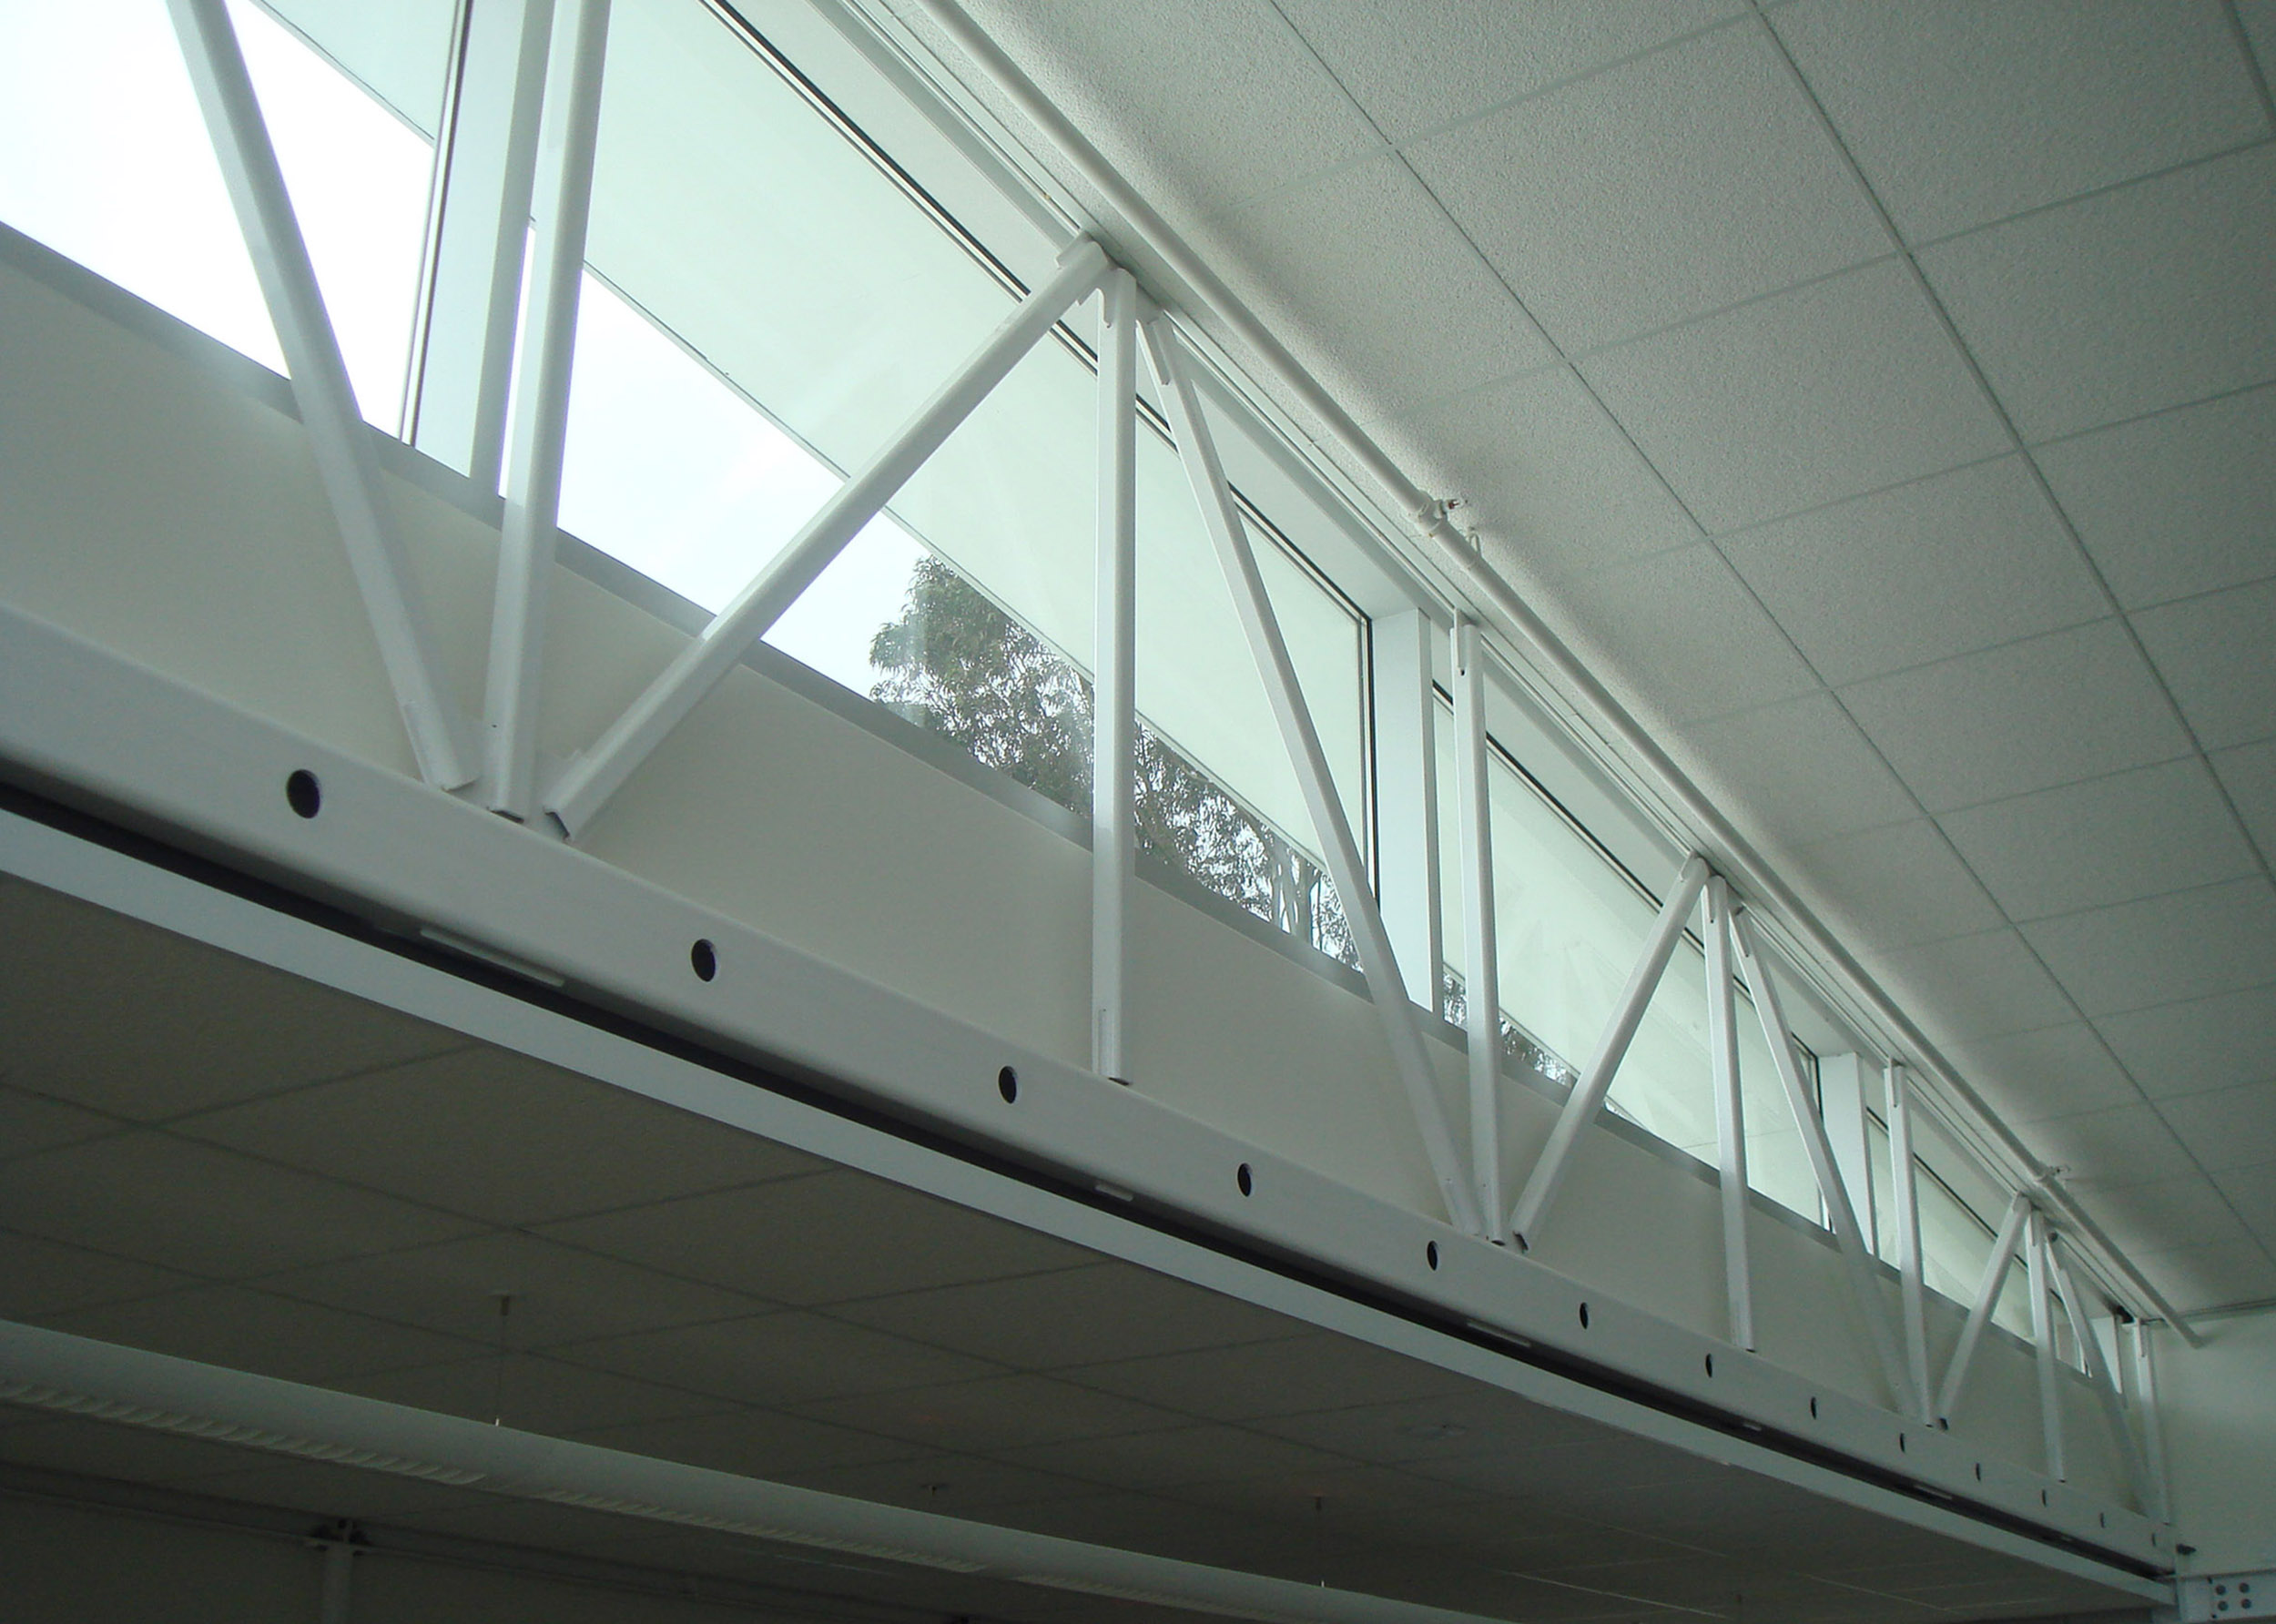
Large glazed areas facing north and clerestory windows on the east and west provide abundant daylight that minimizes the need for electrical light. The light fixtures are connected to occupancy and daylight sensors that respond to room occupancy and maintain required lighting levels.
A series of daylight simulations explored clerestory glazing options to resolve visual comfort challenges including:
– ‘Disability Glare’ caused by direct sun entering the windows and shining on work surfaces or teaching walls.
– ‘Discomfort Glare’ (Direct sun, Bright glazing surface or bright sky visible in the field of view of an occupant)
– Direct sun penetration (certification issues for LEED and CHPS)
– Daylighting illumination (ie availability and distribution of sufficient daylight)
Most acute in the cafe, the problems were solved with a fixed fabric shade that diffused the direct su, reduced contrast glare, and still transmitted daylight from the east and west clerestories.
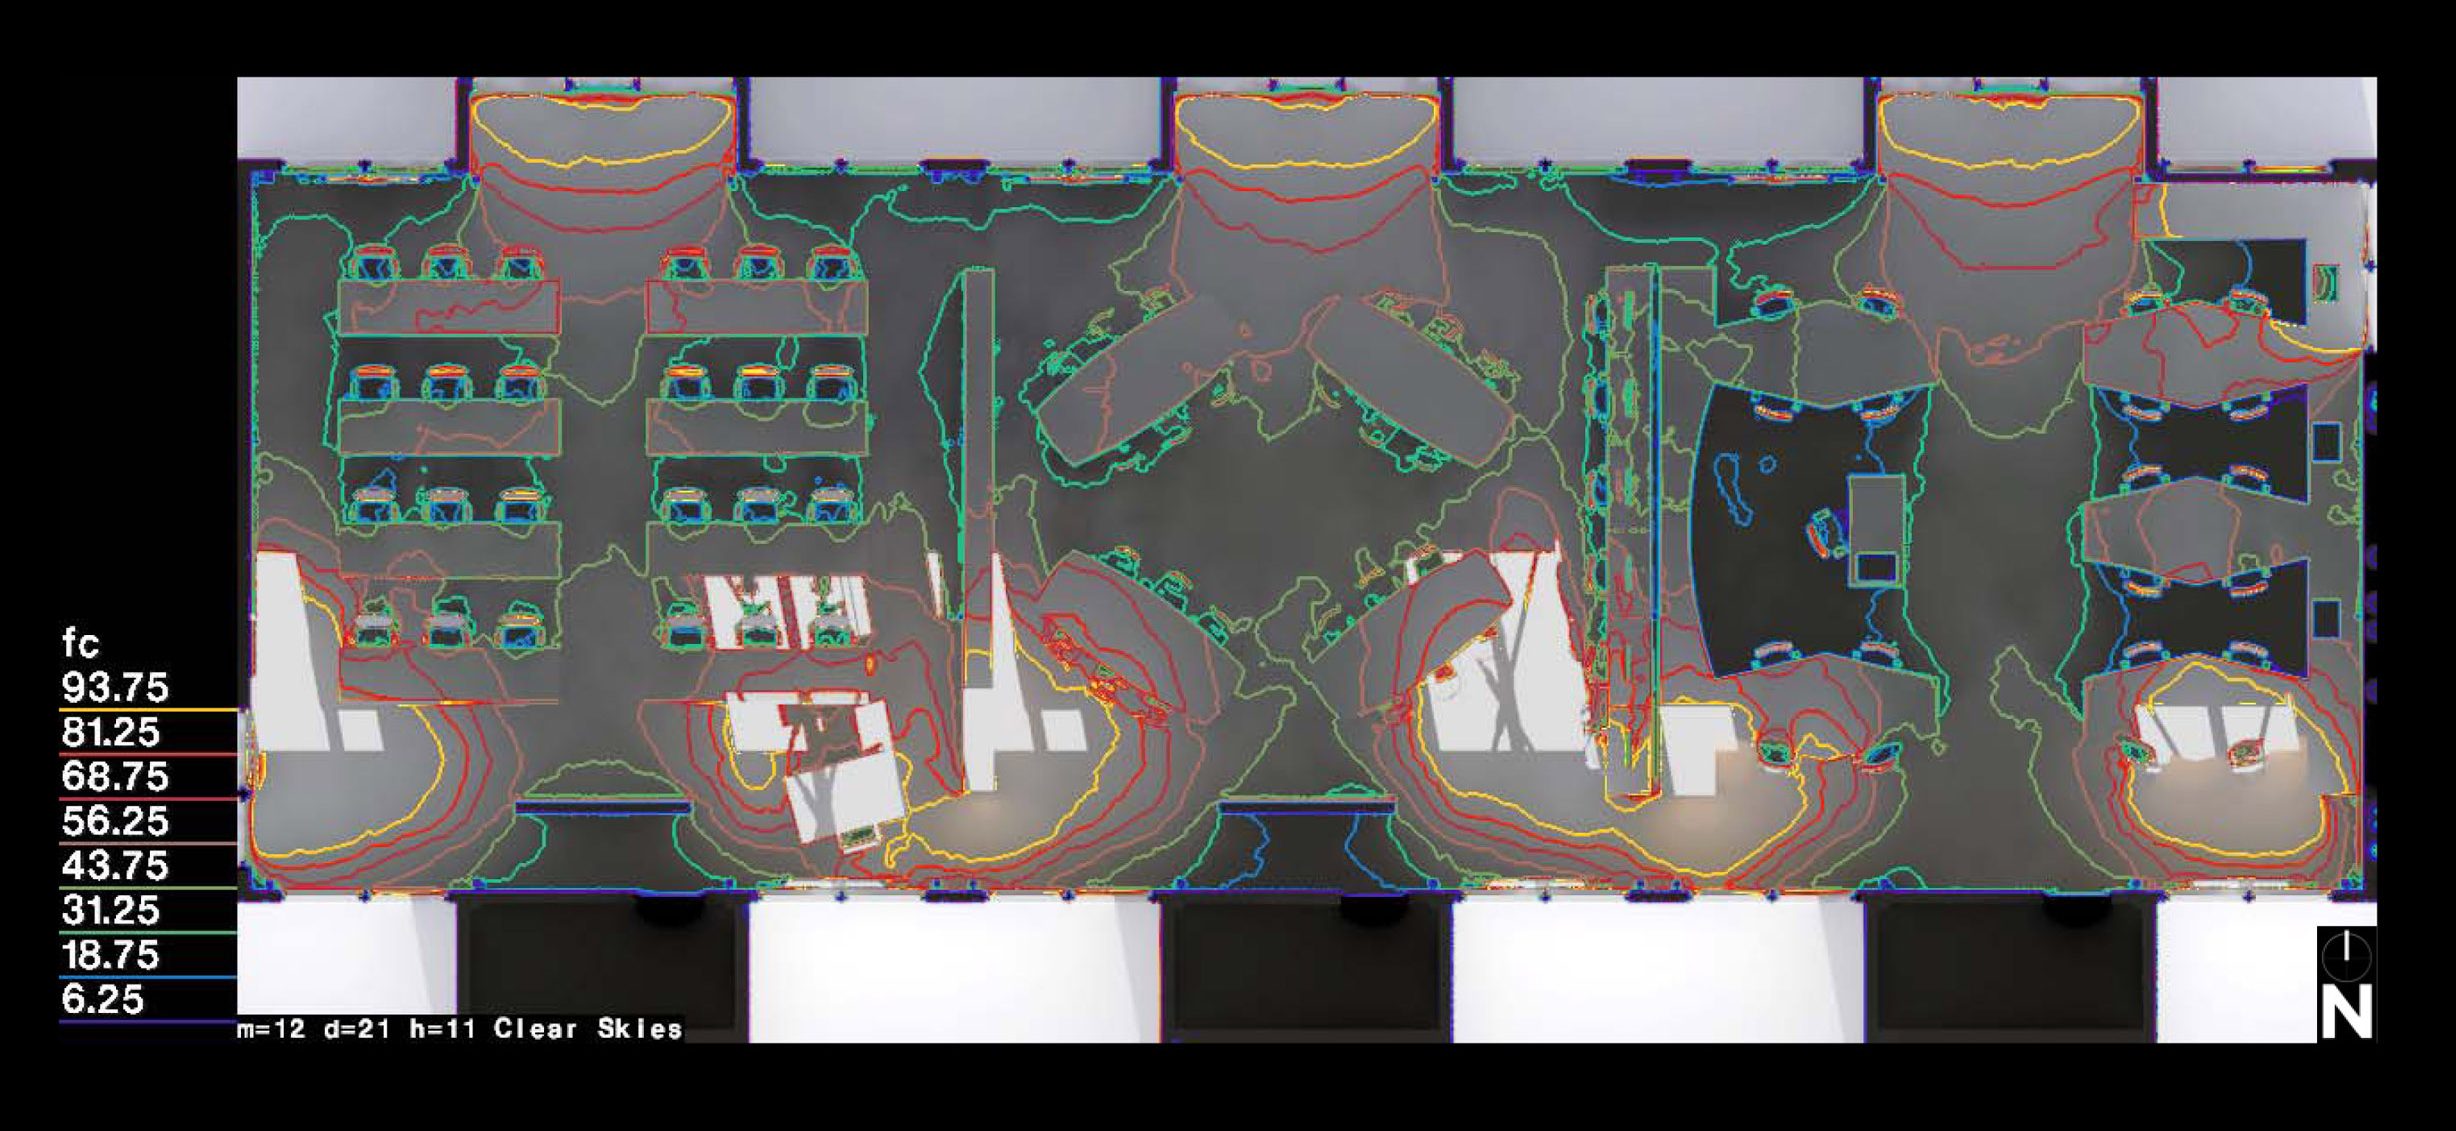
Illuminance Plan in FC – December Clear Under overcast skies in December, the illuminance levels in the classroom fall between 30 and 110 footcandles for most of the space, measured at a work surface 30 inches above the floor.
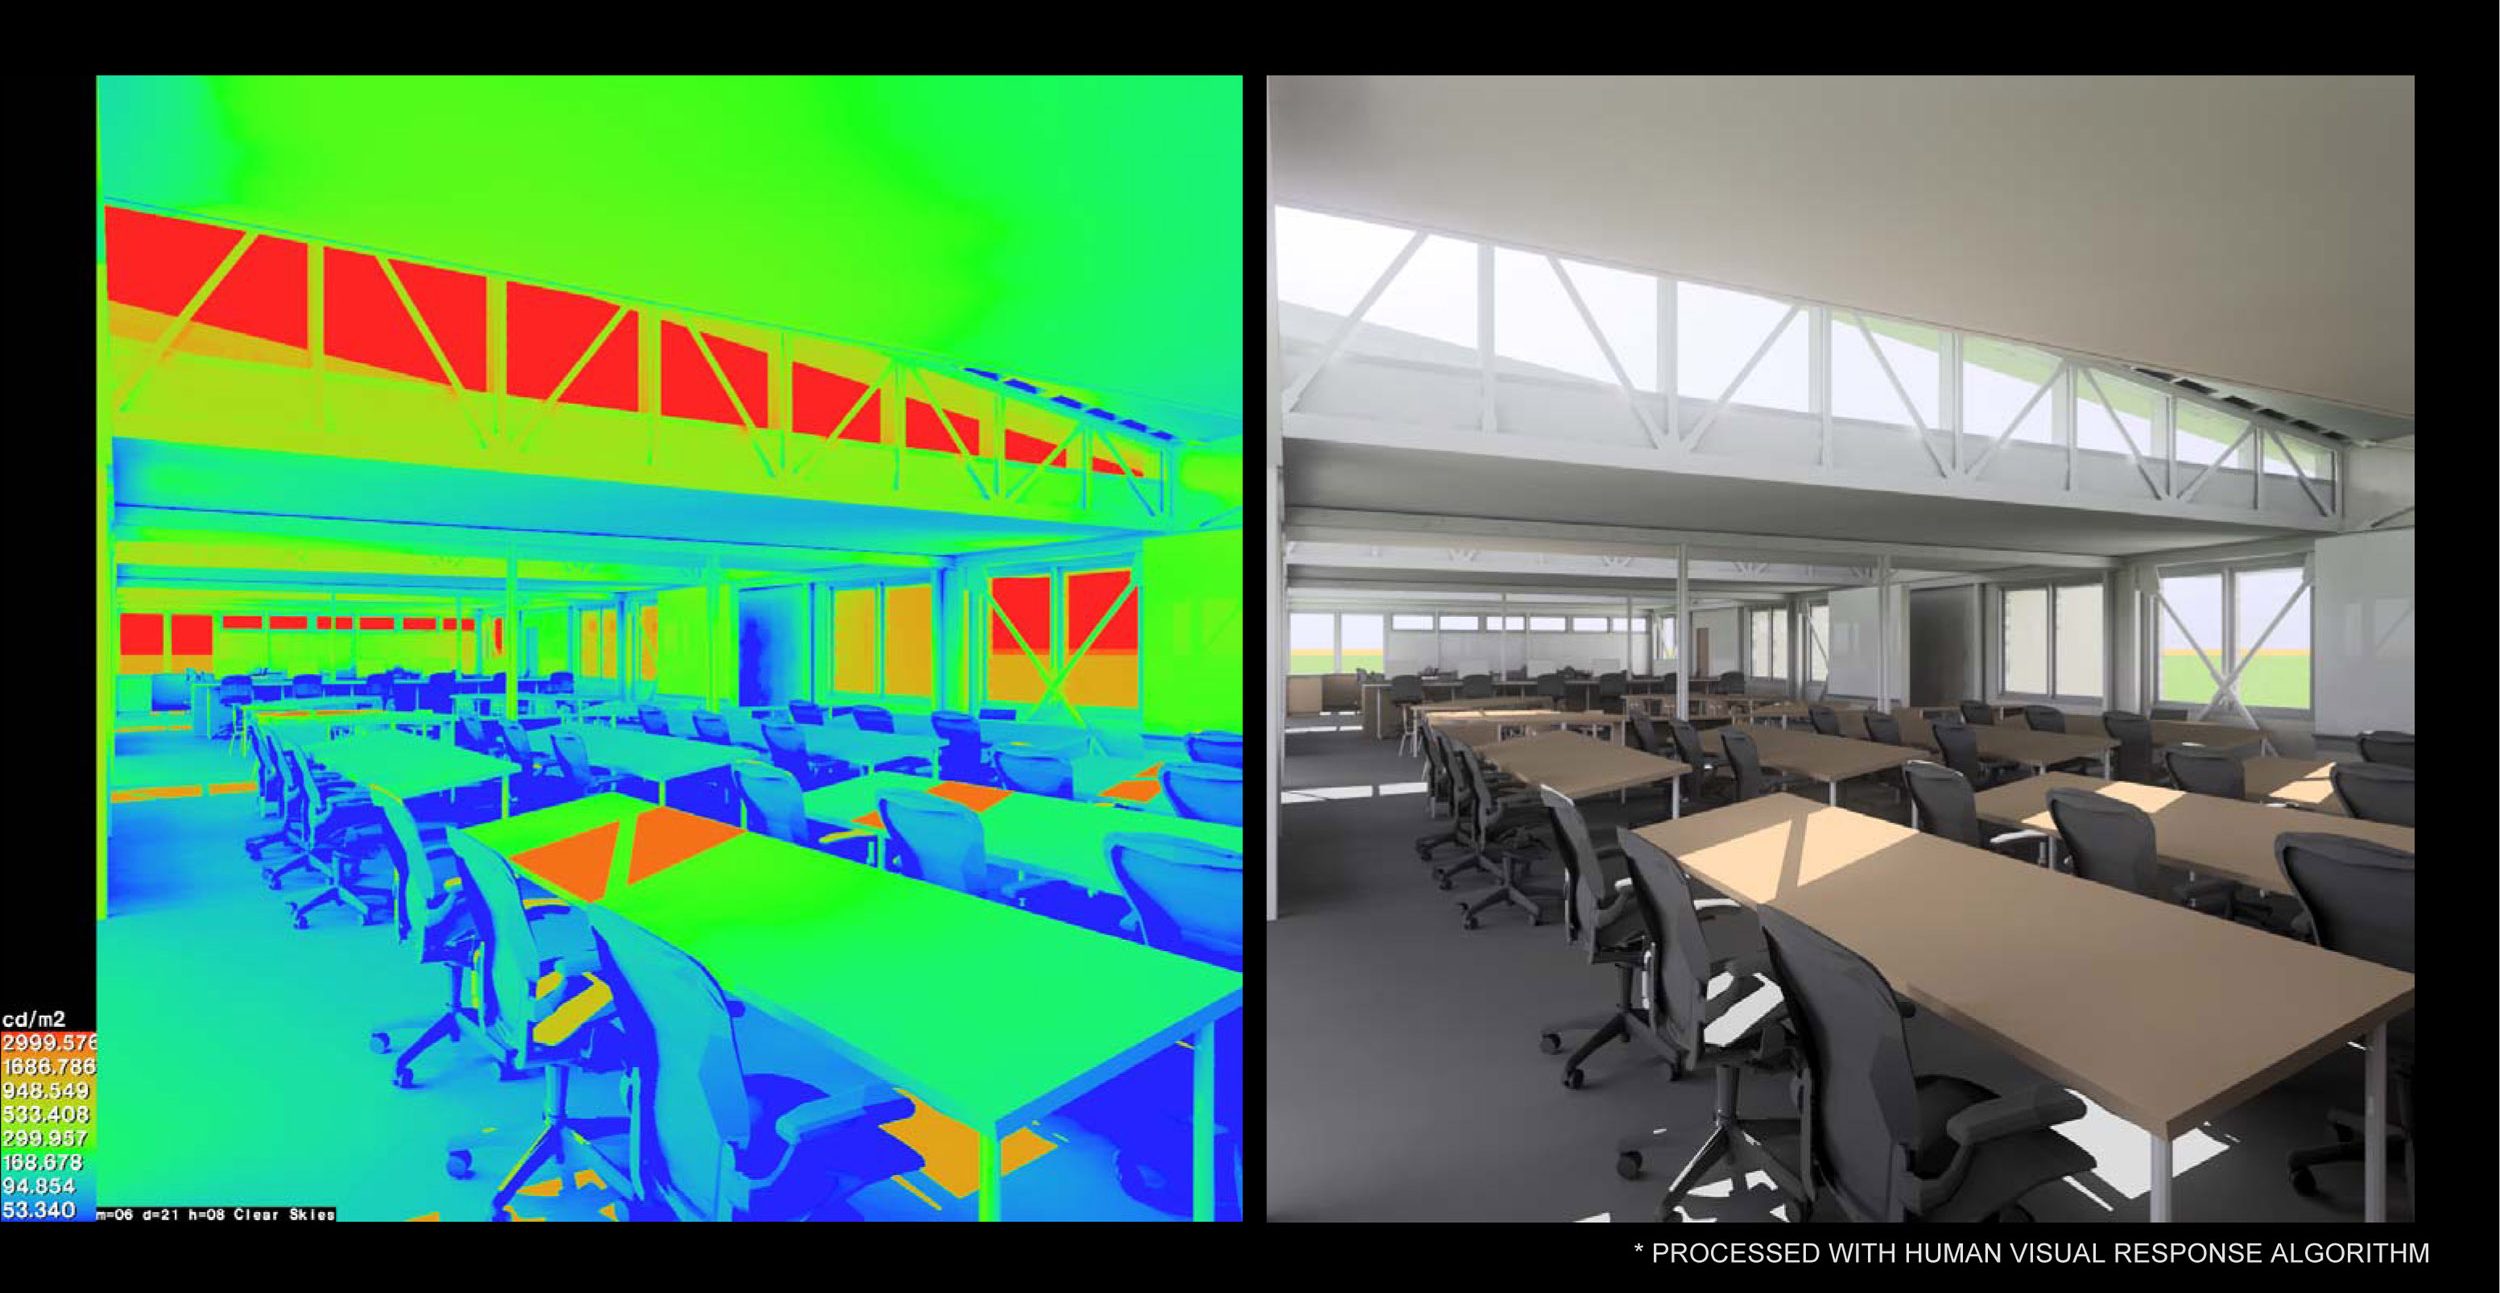
Visual Comfort Study of classroom – June Clear The veiling glare represented in the human visual sensitivity perspective image illustrates the disability glare that the frit pattern does not adequately control for. While this is an extreme condition and one not commonly occurring during school hours, the instance illustrates some of the shortcomings of frit as a mitigation of extreme direct sun.
Photovoltaic Roof
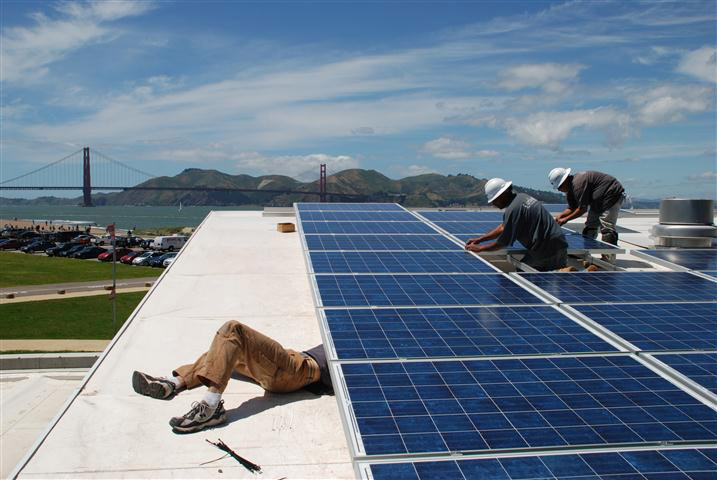
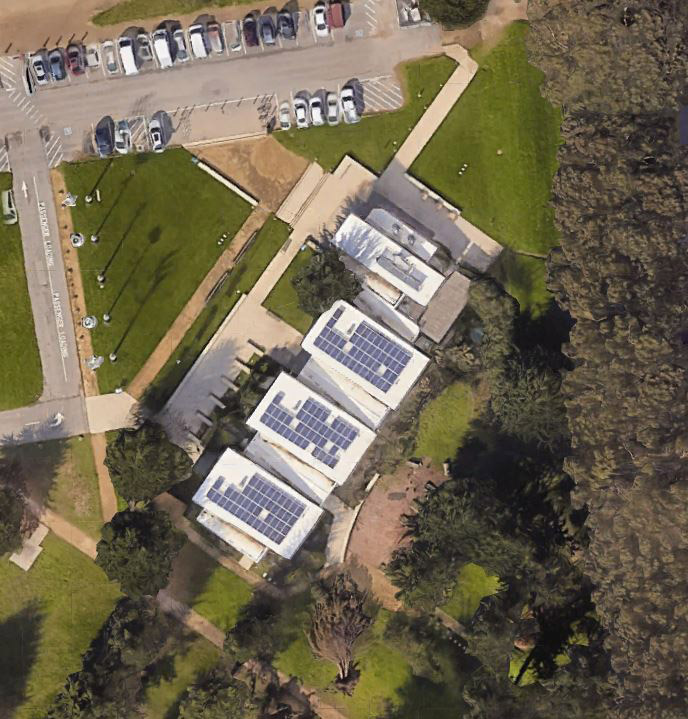
A 28.35 kW photovoltaic (PV) array is mounted on the south-facing roof and includes micro-inverters to convert DC to AC power at the module. The photovoltaic system has proven successful in generating a substantial portion of the electricity used at the Center.
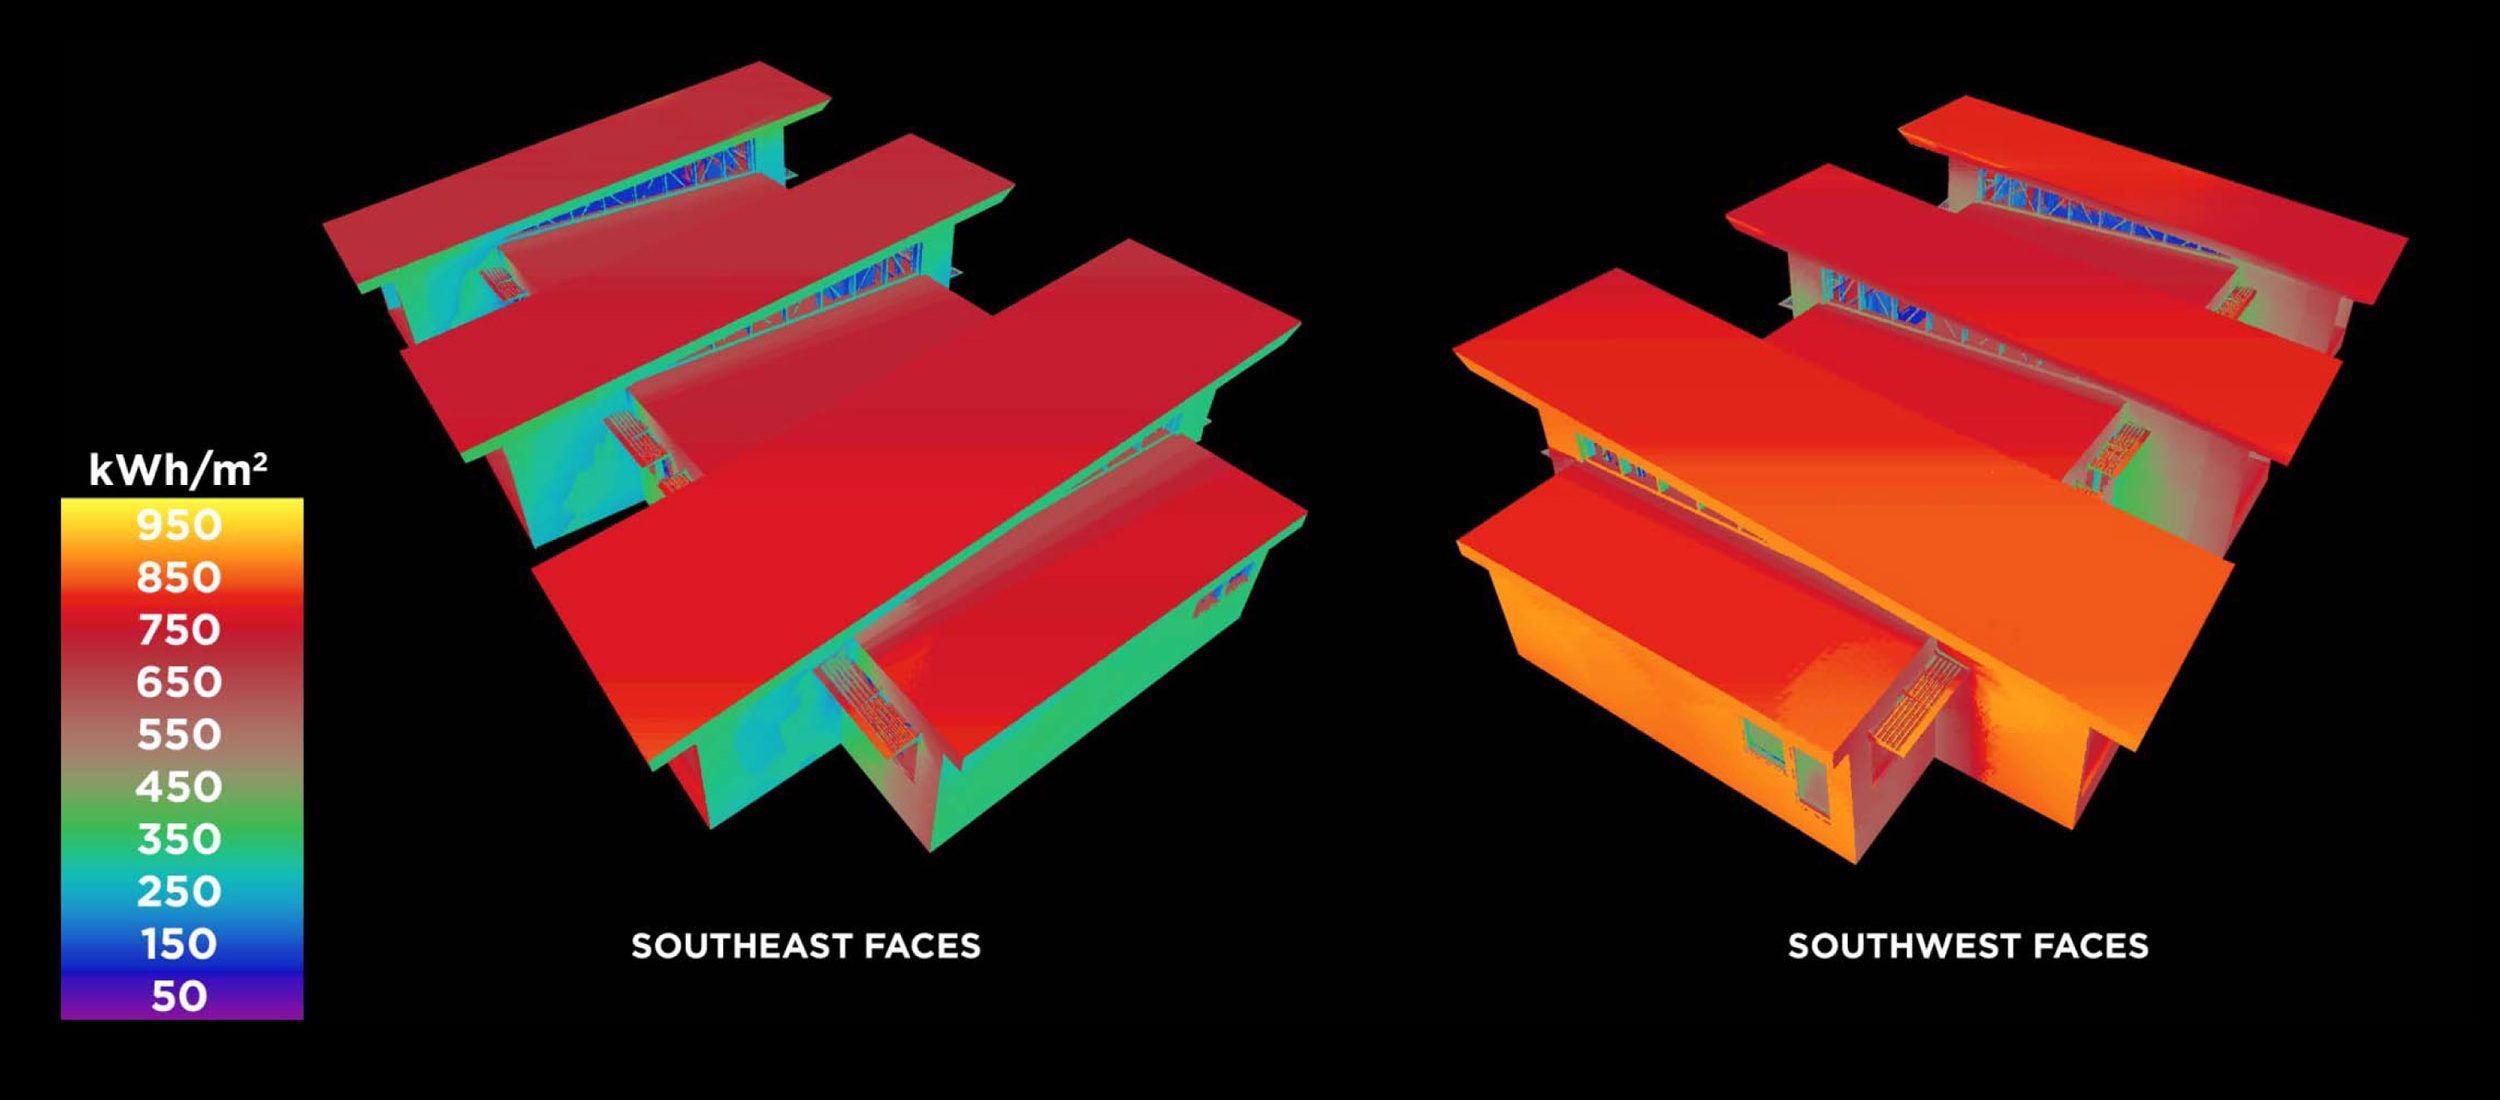
Annual insolation maps that show the cumulative solar energy that reaches an area helped determine the location of the solar panels. Solar energy generation studies showed the number of days per year that a range of array sizes would achieve a daily surplus of energy. Results showed that the building would perform on an energy deficit during only 41 days per year, and over the course of a typical year would produce more energy than it used.
Solar thermal panels
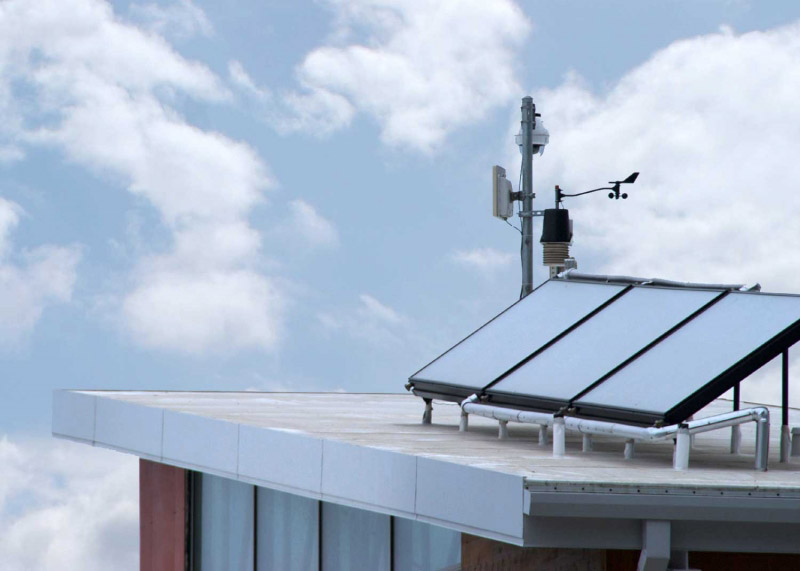
A 9.9 m2 solar thermal collector designed to be the primary supply of hot water for the café is also mounted on the Center’s roof.
Wind Turbines
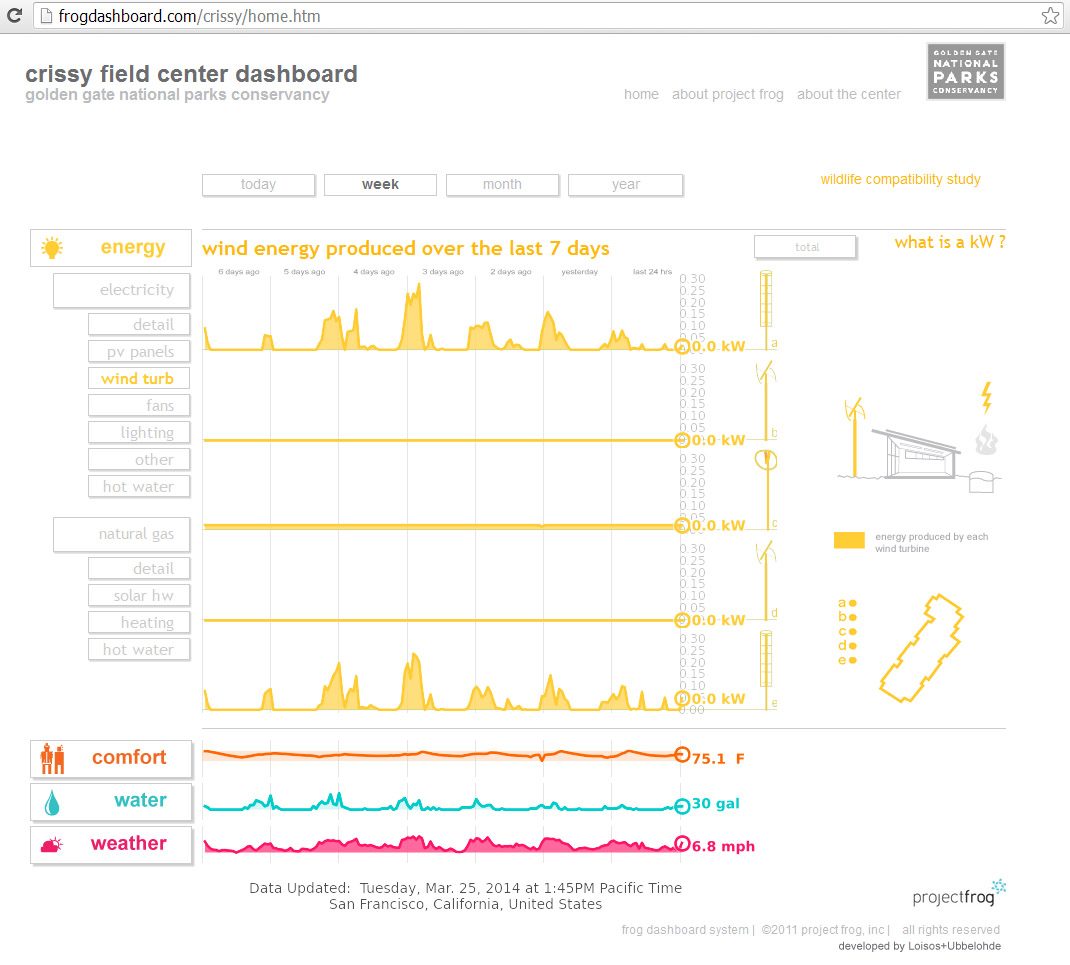
Crissy Field Center hosts a wind turbine pilot project sponsored by the Hawaii Natural Energy Institute. The goal is to collect wind based energy generation data in urban areas, while also conducting a wildlife impact study. The goal of this study was to learn about ways to generate wind power on a small scale in more urban and developed areas rather than wind farms. In 2012, when the research began, little empirical data existed for small-scale vertical axis wind turbines and their impact on birds and bats.
At Crissy, five new vertical axis wind turbines, representing 3 different products, were installed for total of 5.4kW system. This type of turbine is designed to minimize noise and limit environmental impact for urban sites. The anticipated annual output (per unit @ 2,000 hours with 10mph wind speeds) varied from 2,400kWh to 4,000 kWh, and was expected to cover up to 11% of the building’s annual electricity needs.
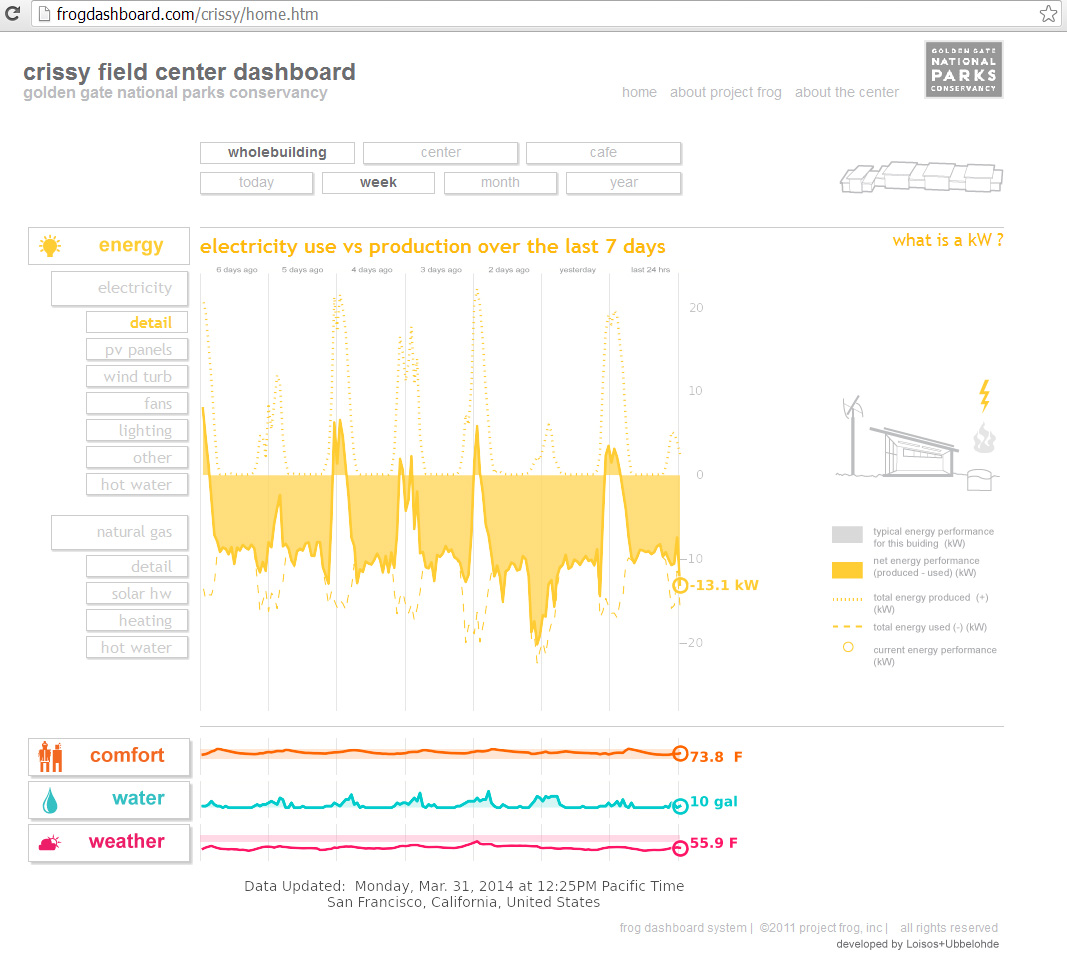
Energy performance for the project is continuously measured by a building monitoring system. On-site sensors and meters track the building’s energy production and use, displaying a direct comparison between occupant comfort, outside weather conditions, and energy efficiency in real time.
To address envelope and mechanical system performance, environmental sensors were specified to monitor comfort conditions. The display is designed to provide an easy-to-understand status summary, and then allow the user to further explore additional details and time scales.
The resulting dashboard helps users to gain insight, rather than simply receiving information, by offering critical data stream comparisons. Actual performance is compared with the likely performance of an industry standard building of a similar size and type. The user can also compare the building’s current performance to its typical performance, and look for deviations and possible explanations. Data streams are compared to each other through their adjacent display: for instance, comfort can be compared to the energy use of building systems to indicate if systems are operating effectively and efficiently. The dashboard can also reveal components of comfort by showing, for instance, the surface temperatures as well as air temperatures.
Zero Net Energy Performance
When comparing the predicted energy performance of the building against metered data, it is evident that simulations underestimated the energy use (the building used 62% more energy in 2014 than predicted) and overestimated the energy generated by the wind turbines (they produced 11% of the predicted energy). Based on the detailed review of the data available through the monitoring system, the difference in the energy use performance is due both to the underestimation of the equipment loads, that account for 80% of the actual energy use on a typical week, and to the lighting energy used for the cafe not matching the predicted need for electric lights to be on given the daylight availability.
Modeling Energy Results vs Actual Measured Energy Data
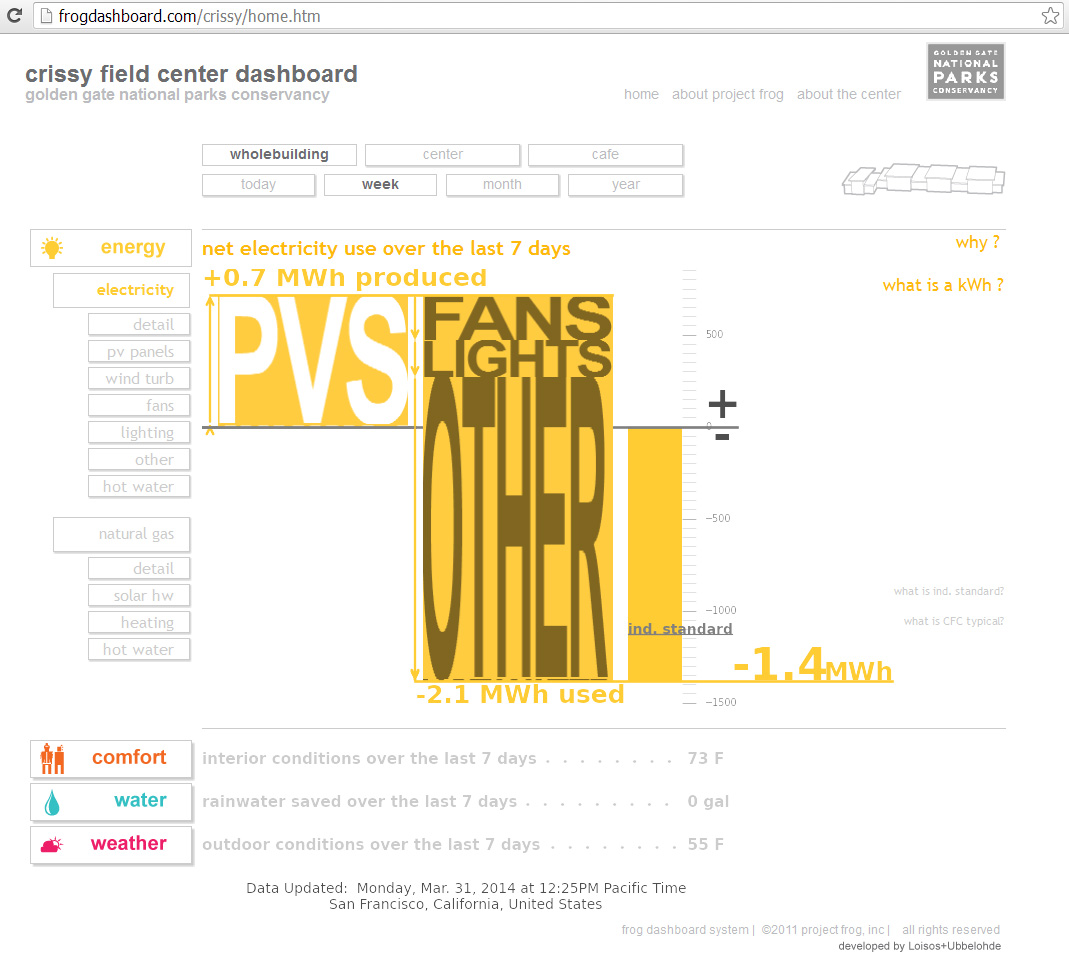
Dashboard Screenshot: Net Energy Perfomance and End Uses
In the dashboard, an energy summary graph scales text height to emphasize end uses that are more significant. The graph shown here is typical of multiple time periods, with PVs producing so much more energy than the wind turbines that the bar representing the wind turbines is all but invisible (located beneath the section labeled “PVS”).
We see that “OTHER” accounts for most of the electrical load. Subsequent inquiries revealed opportunities for optimizing energy use, such as replacing an industrial refrigerator that is lightly used (and was donated to the center), or working with the IT department so that all computers don’t have to remain on all the time just for an infrequent software update.
Energy Consumption by End Use
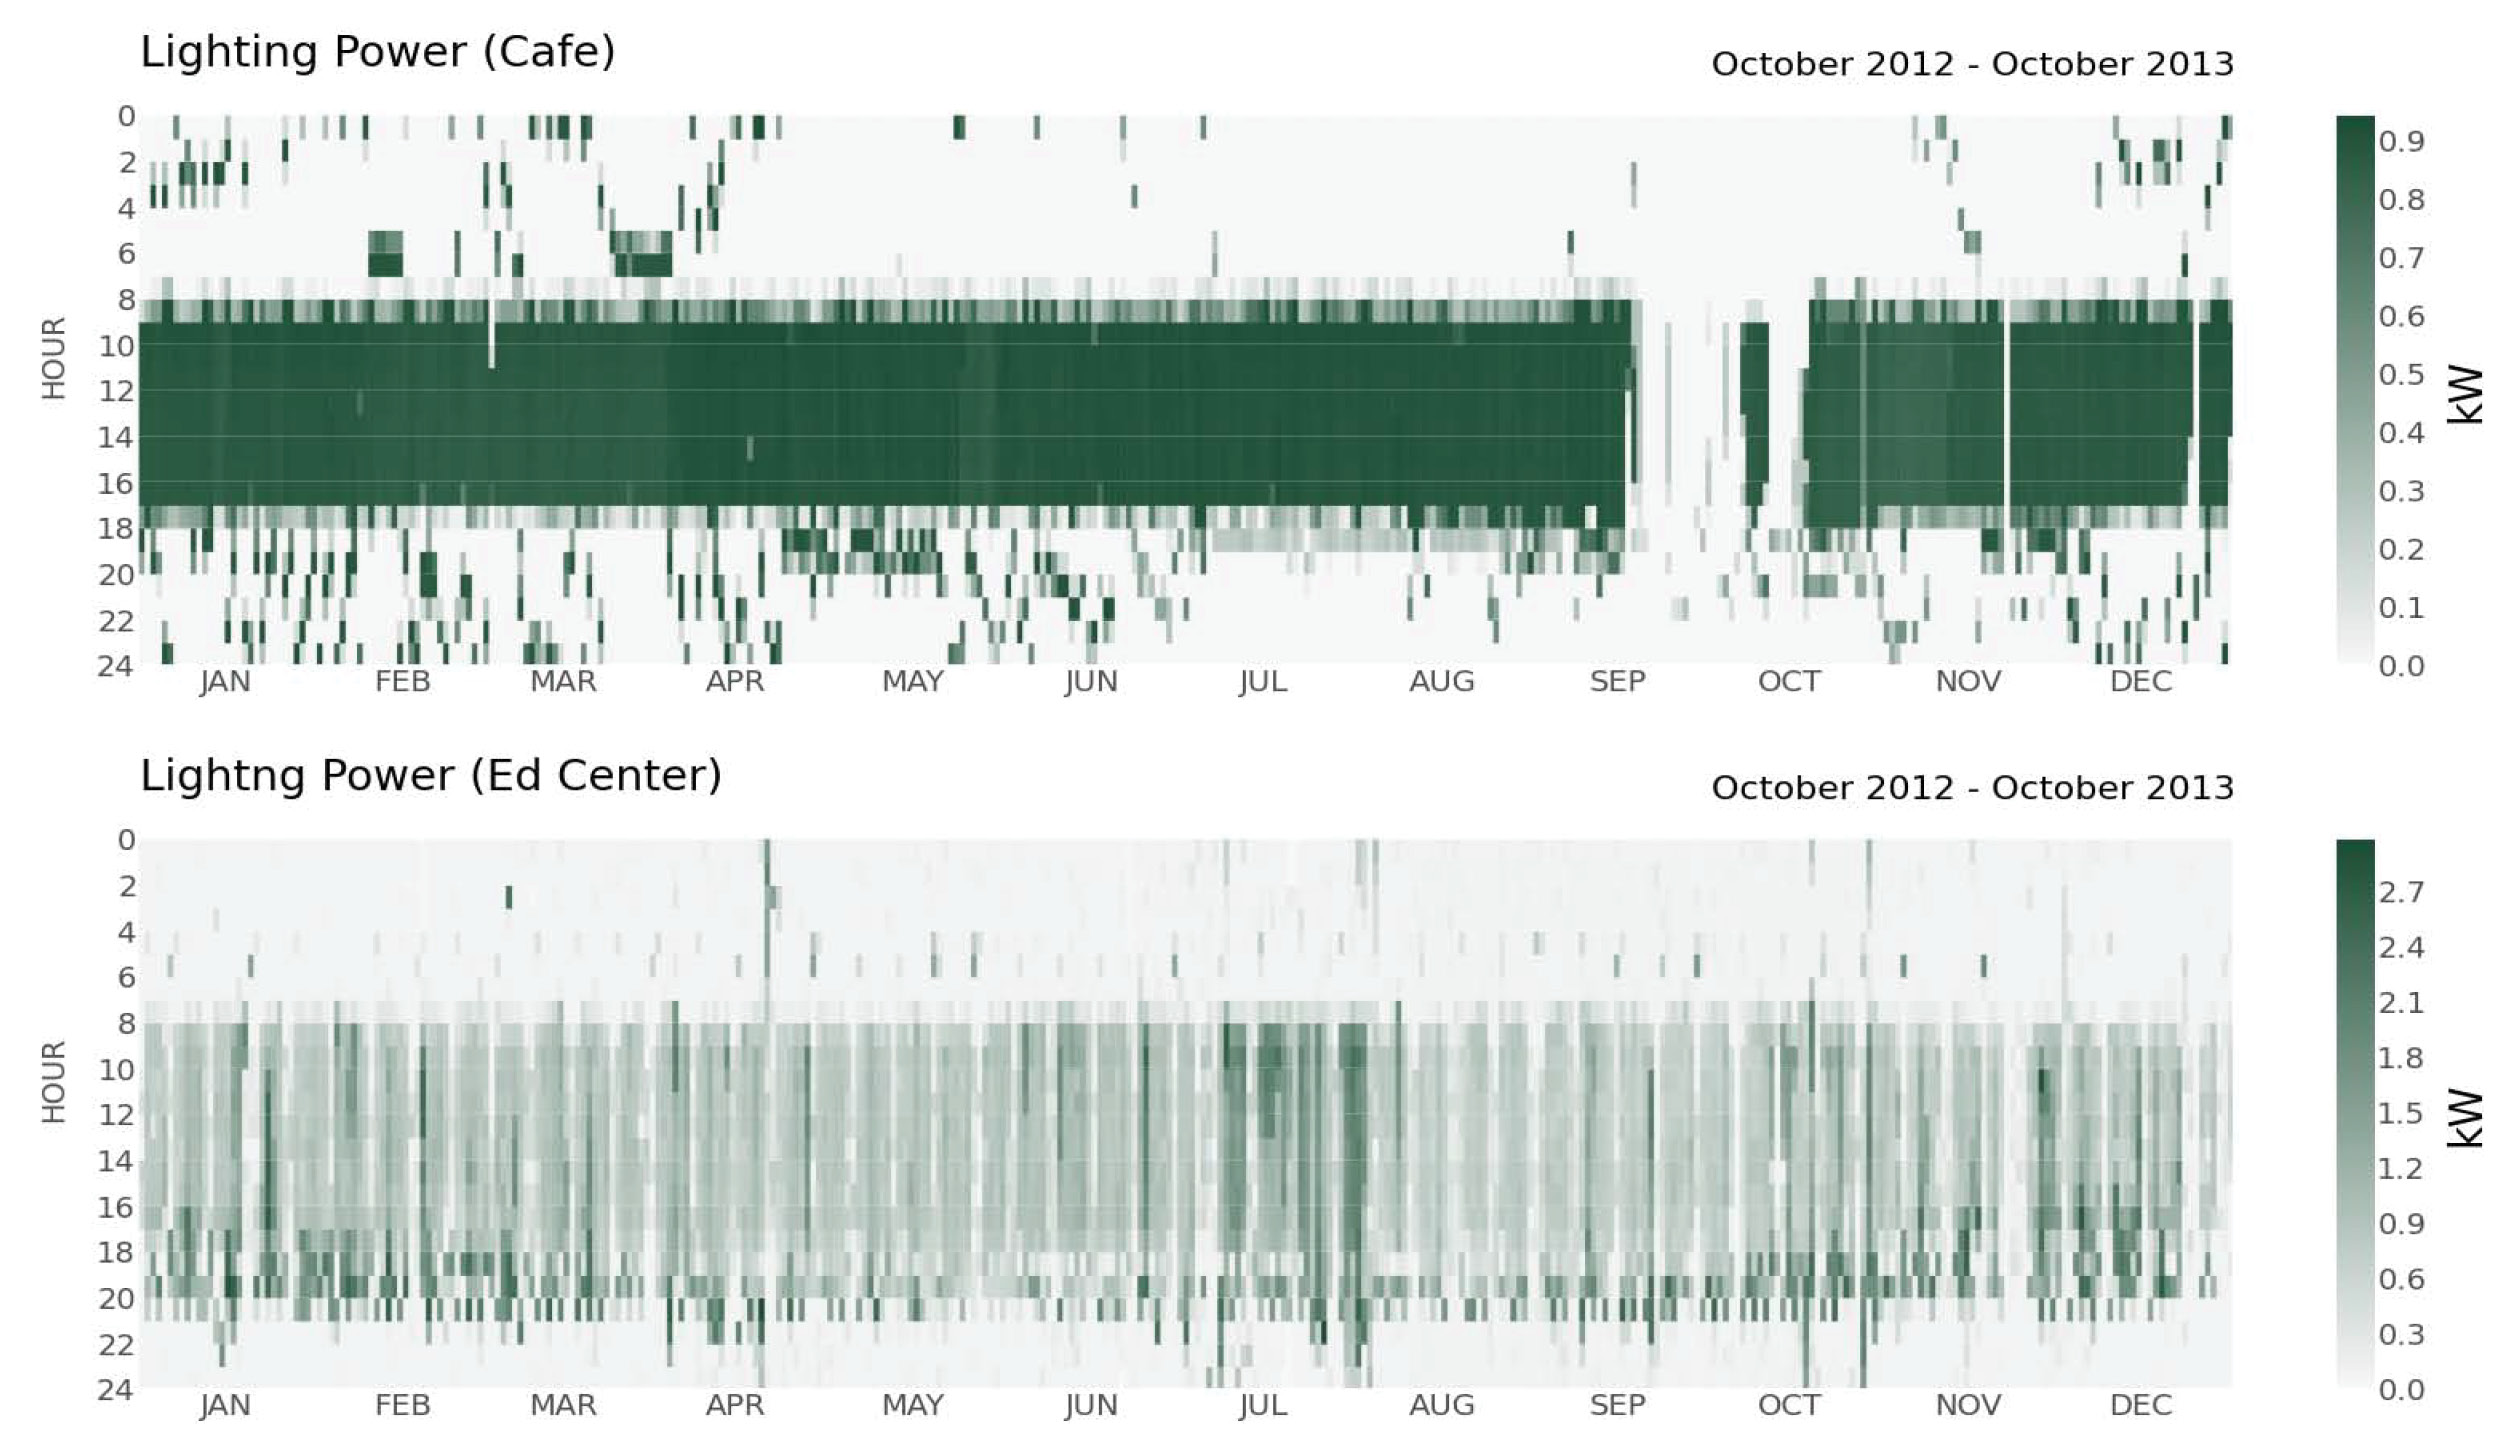
Beyond use in the Crissy Field dashboard, the extensive data collected is available for analysis of a wide range of questions. We were interested in the patterns of lighting use in a highly daylighted building.
The top graph on the left shows the electric lighting performance of the cafe over the course of the first year of data. This annual representation graphs points colored by a mapping of data to color value intensities and located with hour of the day versus day of the year so that larger trends in the most fine-grained data may be revealed.
Note that electric lighting use in the center seems to change with occupancy and availability of daylight, as opposed to the cafe that operates purely based on a regular daily schedule. In the center, note the weekday/weekend patterns and reduced use during summer months due to lighting controls and varying schedule patterns.
Hourly Graphs showing electric lighting performance in the cafe (above) center (below)
A dashboard displaying Energy, Comfort, Water and Weather was developed for both public education and facilities management.
Energy Generation
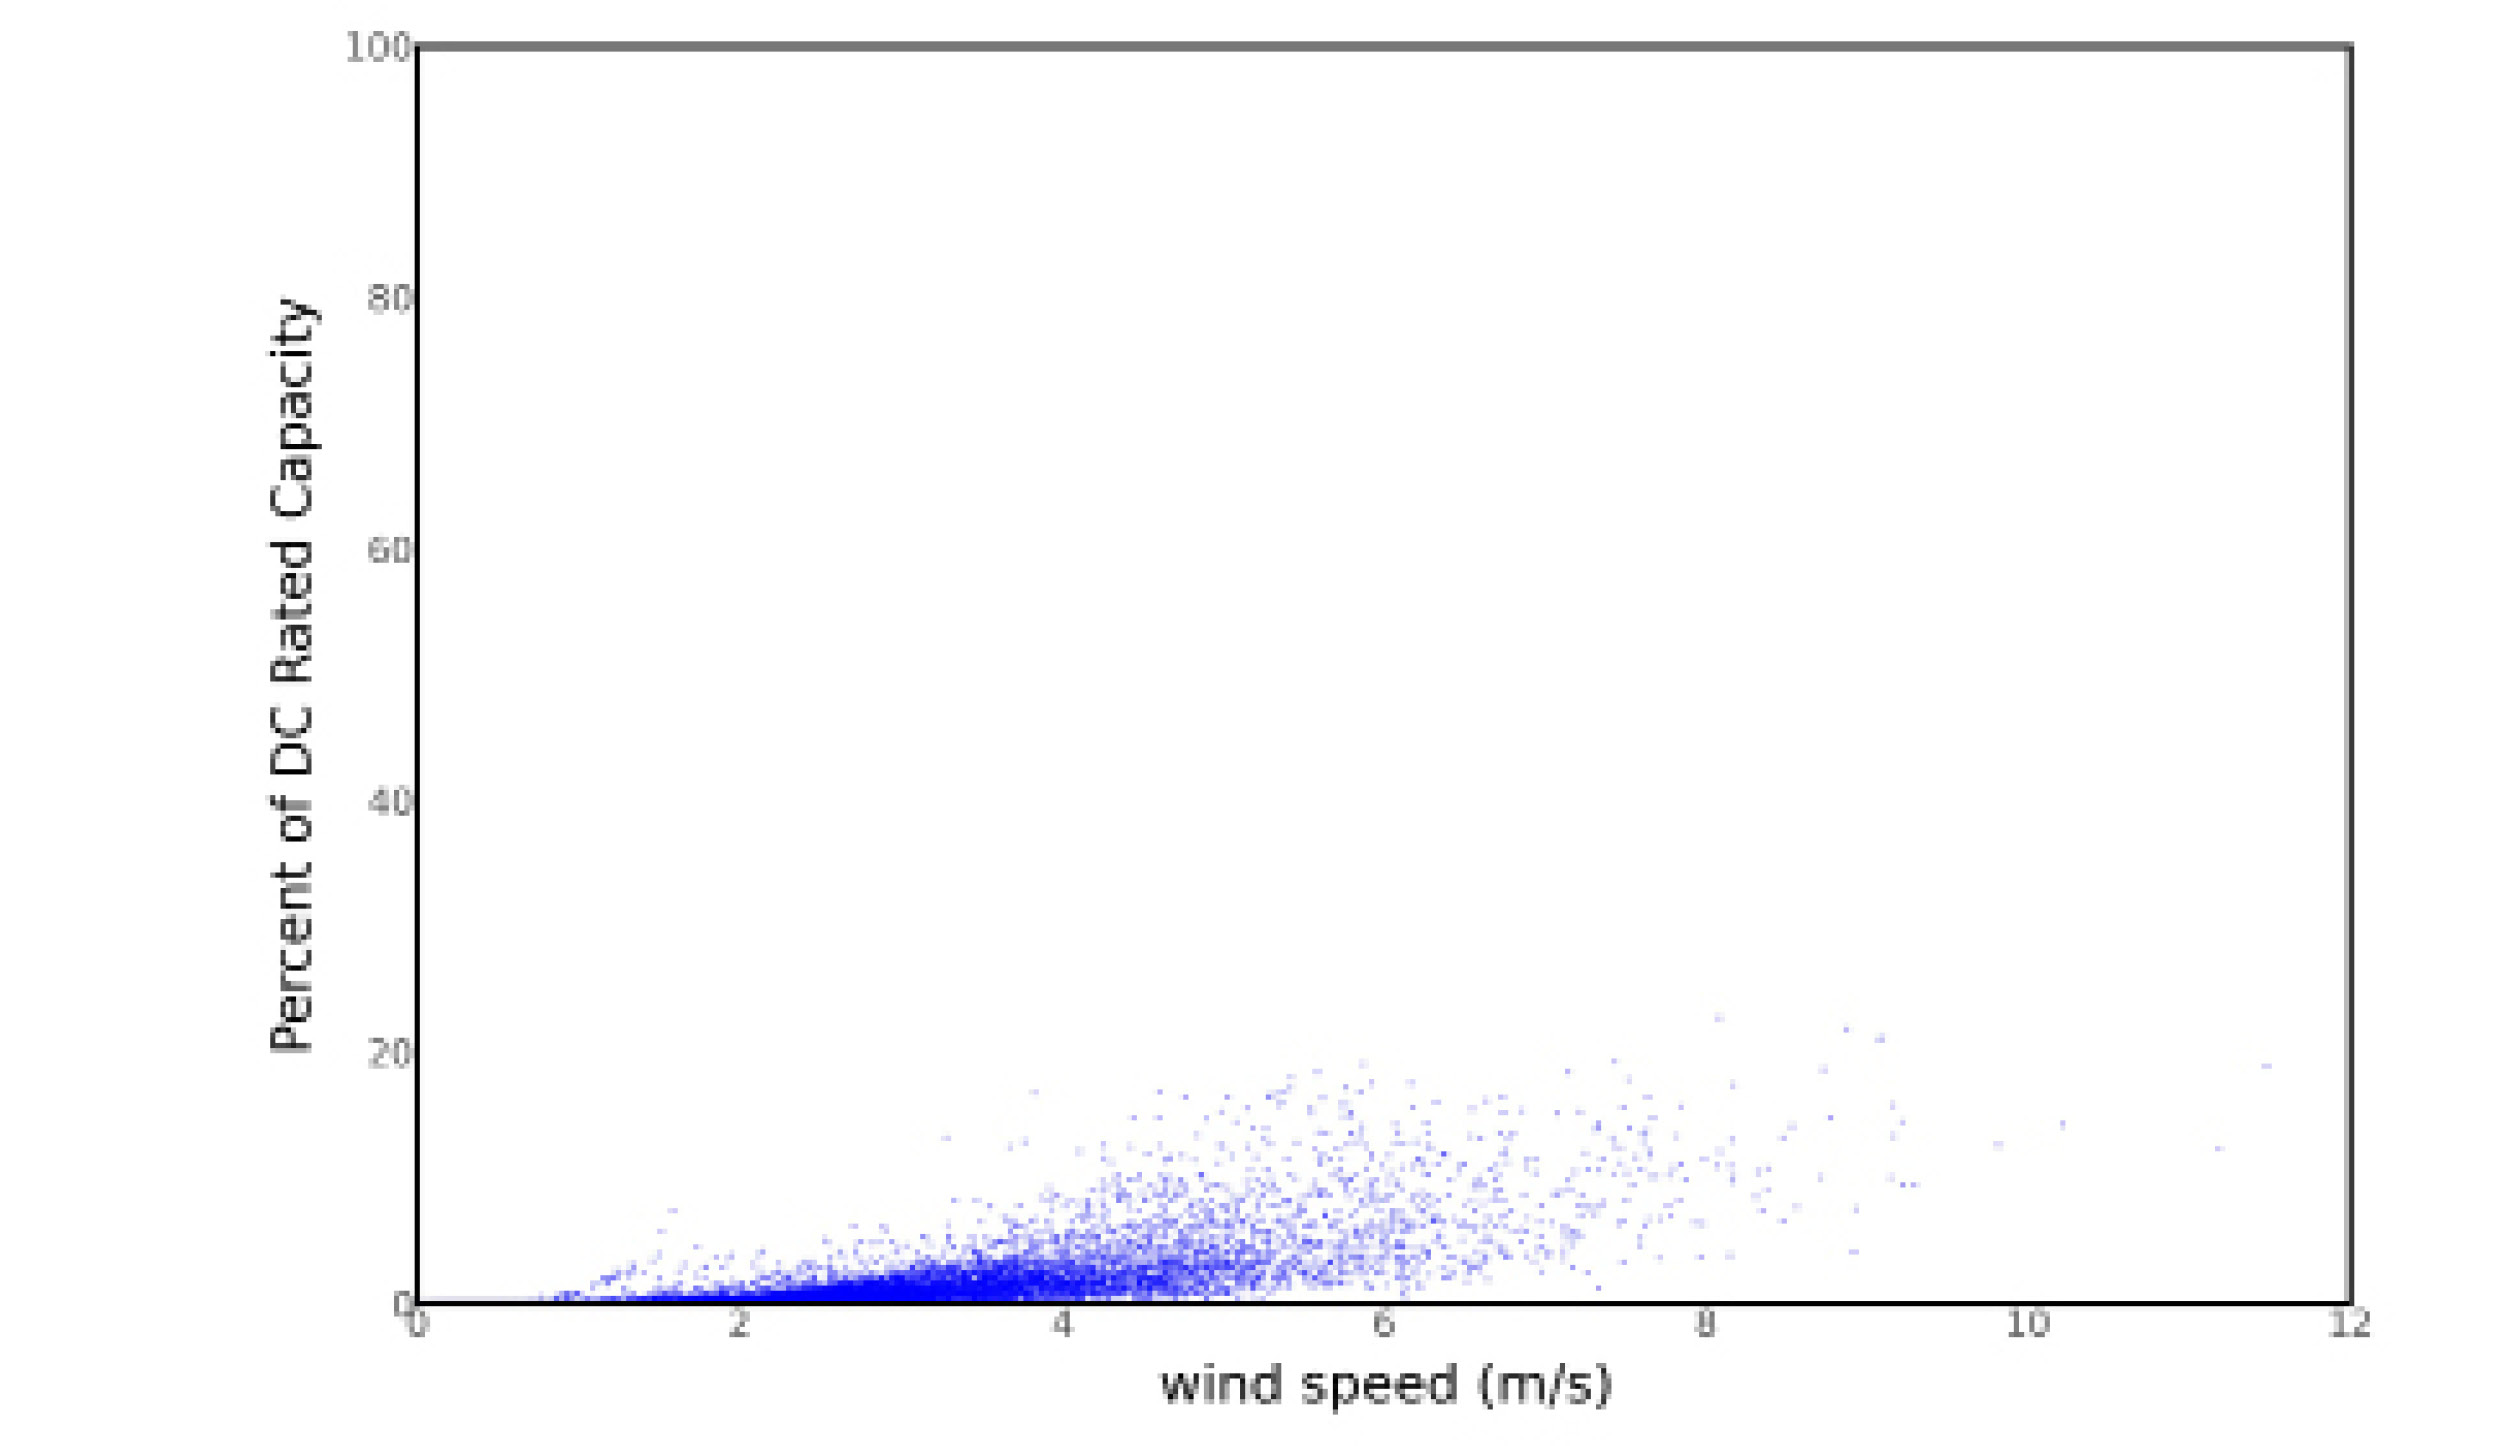
Although the vertical-axis turbines were “very quiet” and presented “a minimal hazard to wildlife” (only one bird kill and another possible bird strike were recorded), they left much to be desired in terms of power generation and durability.
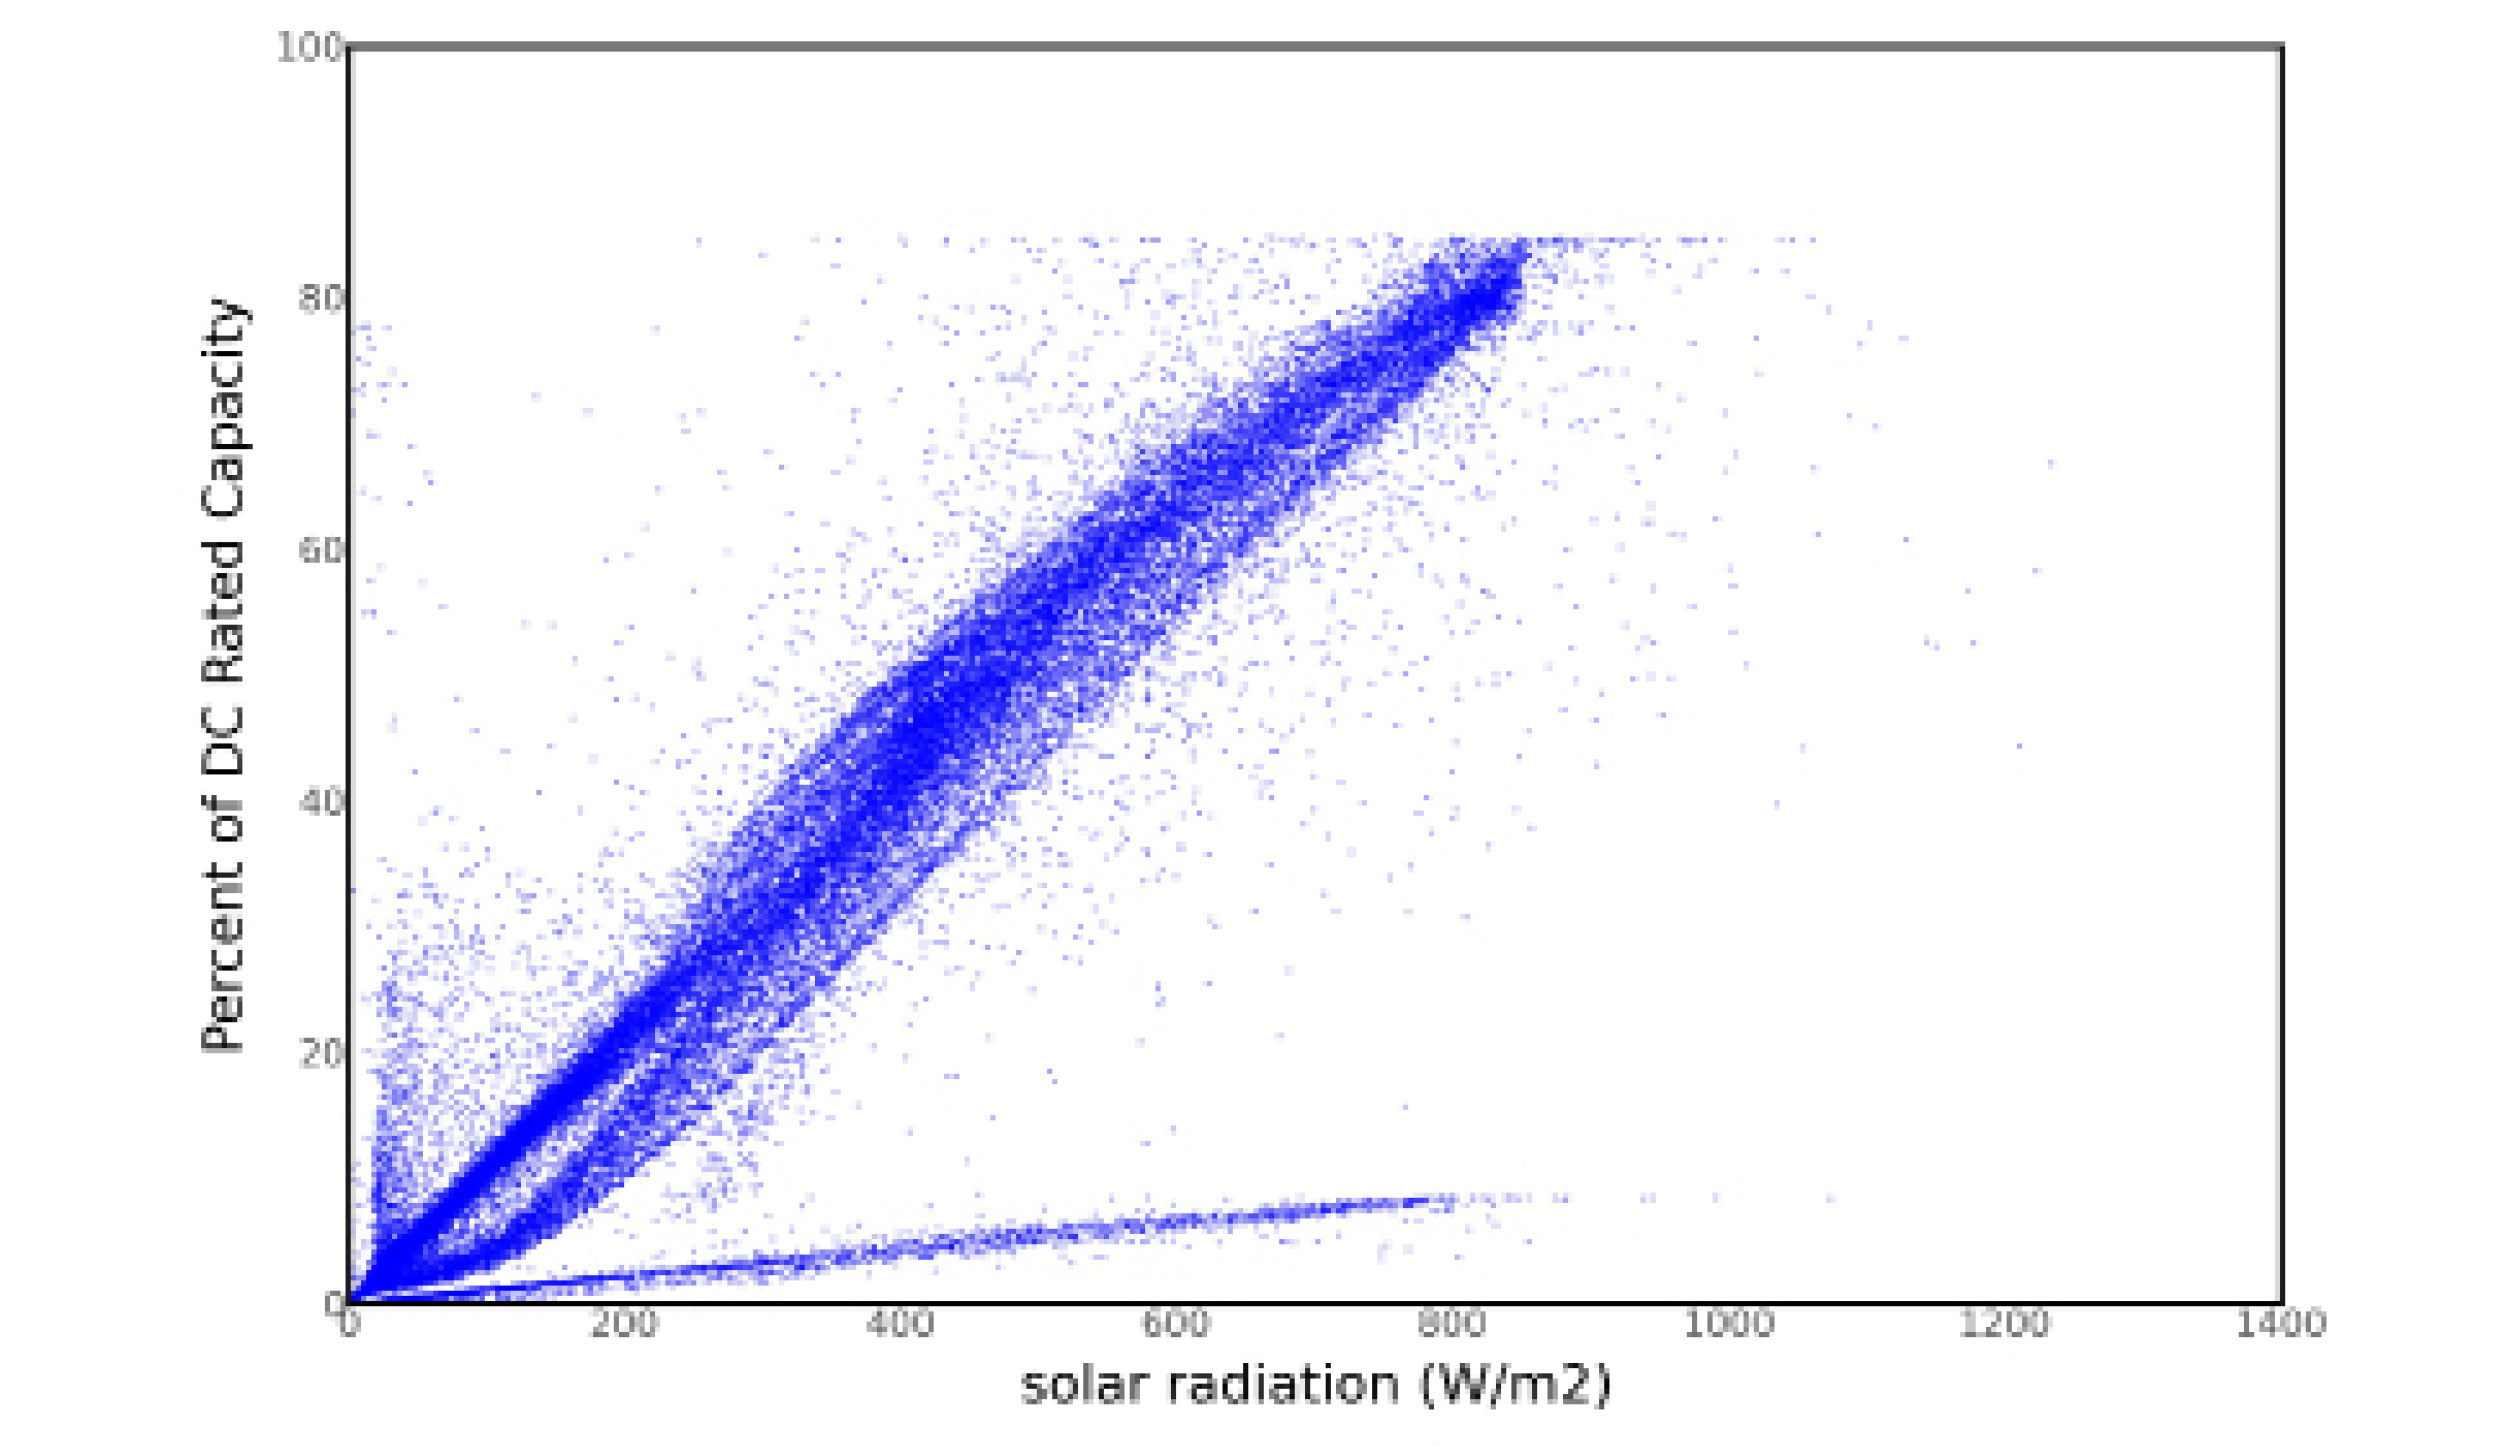
Scatter plots showing the measured output of wind turbines (top) and photovoltaic panels (bottom) as a percent of their rated DC output vs. wind speed and global horizontal solar radiation, respectively. Output is normalized by graphing percent of capacity. The predictability and consistency of the PVs becomes readily apparent, as does their ability to produce up to about 85% of their rated capacity. While this definitively shows the poor performance of the wind turbines relative to their rated capacity, more research is needed to identify the reasons for this before conclusions can be drawn regarding this technology.
Output of wind turbines (above) and PV panels (below) as a percent of theri rated DC outdput vs wind speed and global horizontal solar radiation respectively.
Project Details
LOCATION: San Francisco, CA
ARCHITECT: Project Frog / MK Think
Status: Occupied, 2010
Client: Golden Gate National Parks Conservancy
Area: 6400 sf
Cost: $ 1.05 million
